

Is the Housing Market Crashing? What the Data Shows
Buying a home remains expensive, but selling one has become harder. High mortgage payments are keeping buyers away, while many owners would rather wait than accept a lower price. That can leave the market with fewer sales but little relief for buyers.
In October 2026, sales of previously owned homes were 8.8% lower than a year earlier. Yet the median, or middle, sale price was $416,700, up 0.4%.1 The national figures do not show a housing crash, but they can hide local declines.
Recent Wealthion interviews with Nick Gerli, founder of Reventure App, and housing analyst Ivy Zelman help explain why some markets are weakening faster than others. Their observations also address the larger question: what would turn today's slowdown into a broader fall in home prices?2, 3
Home prices are falling in some places
A national price figure can look steady even while particular towns become cheaper. Gains in stronger markets can offset declines elsewhere, leaving both experiences hidden in one number.
Gerli describes that split in parts of the Sun Belt, including Florida and Texas, where he sees more homes competing for buyers. He contrasts them with parts of the Northeast and Midwest where limited supply supports prices.2 October's regional figures show why a single national number is insufficient:
Regional prices are moving differently
Change in median existing-home sale price, October 2026 versus October 2025
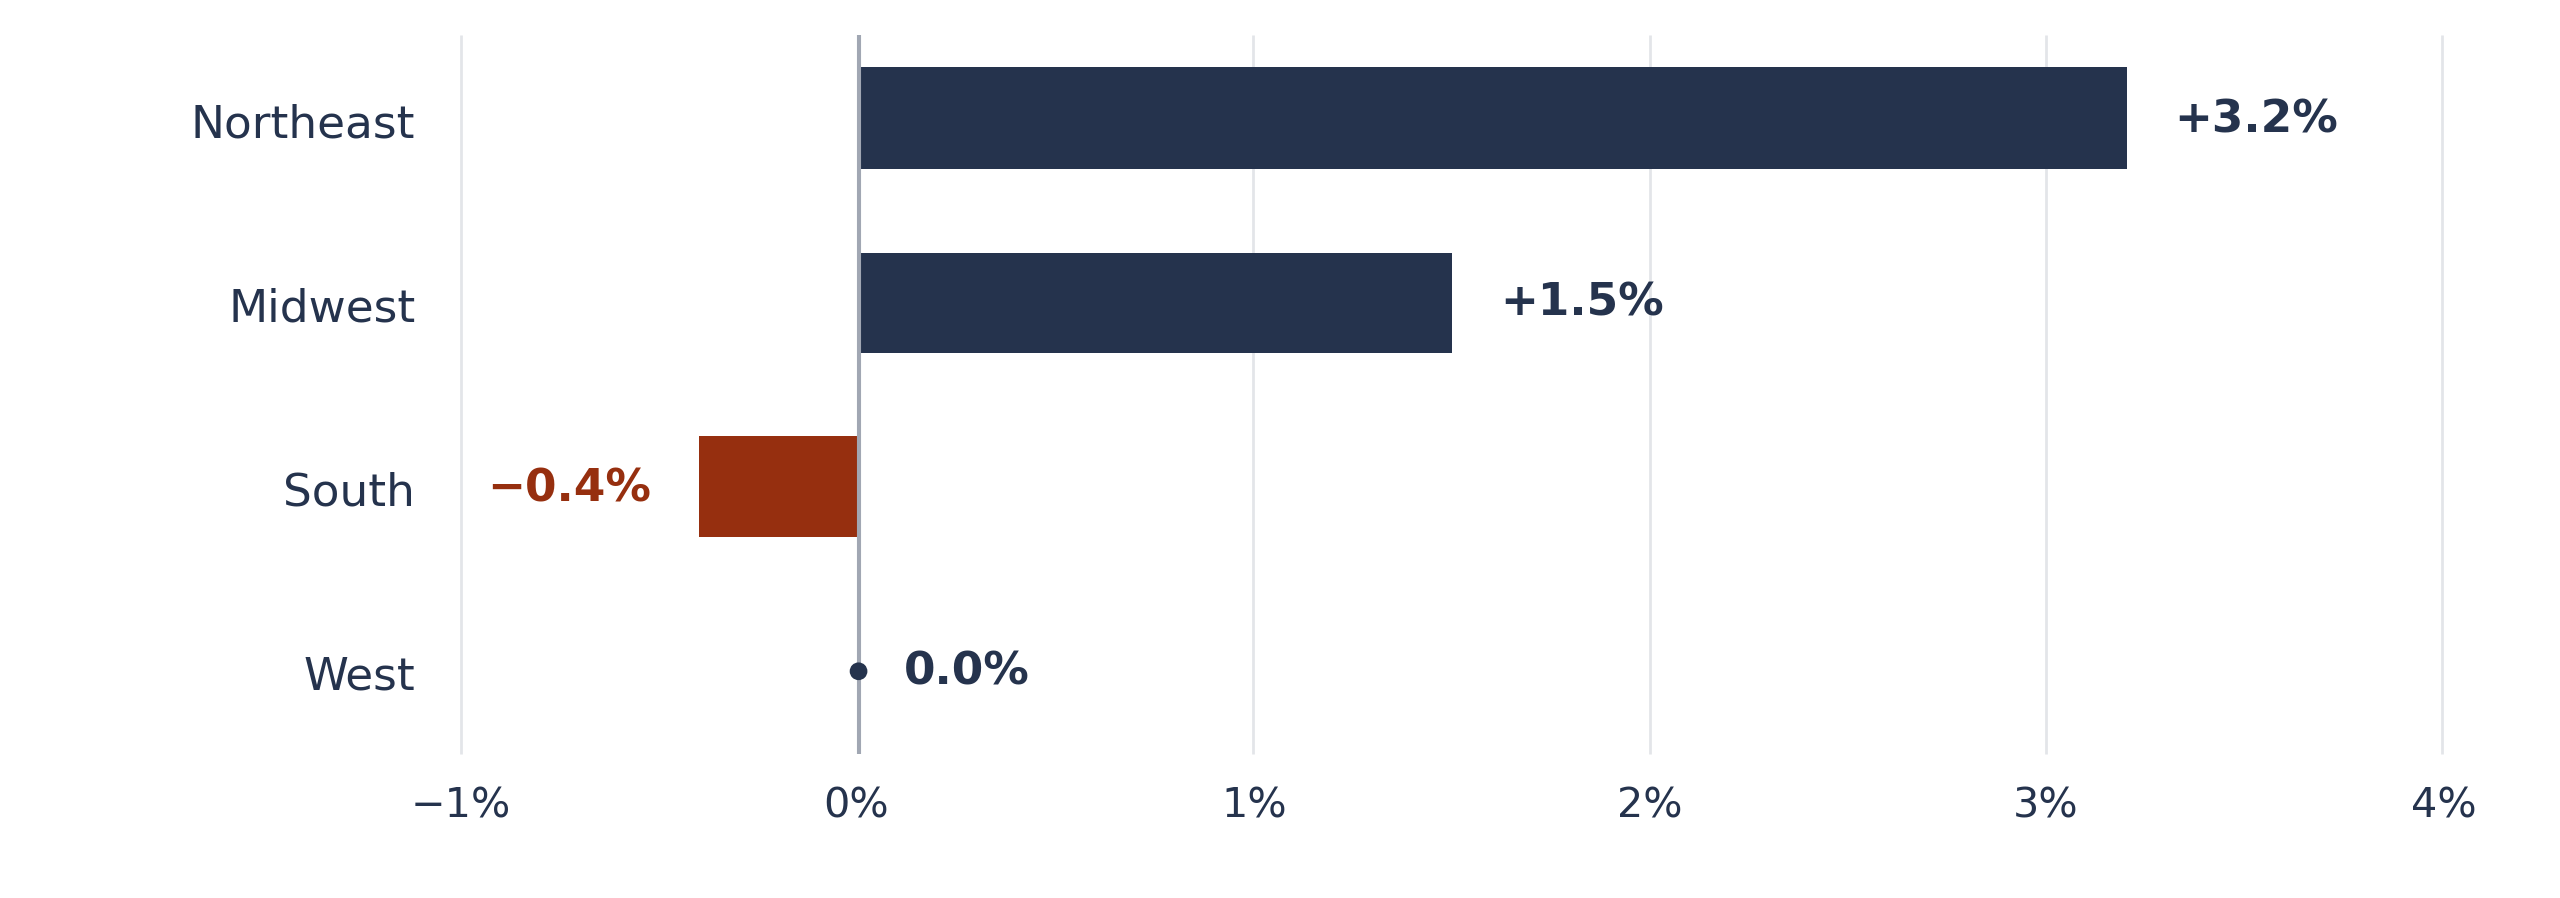
Source: National Association of Realtors. Medians reflect the homes that sold.1
There is another reason to interpret these figures carefully. The median is the middle sale price when transactions are ordered from cheapest to most expensive. Imagine three homes sell for $200,000, $300,000 and $600,000: the median is $300,000. If next month's sales are $300,000, $600,000 and $800,000, the median becomes $600,000. That does not prove individual homes doubled in value. More expensive homes happened to sell.
The Federal Housing Finance Agency uses another approach: comparing sales of the same properties over time. That helps separate changes in a home's price from changes in which homes sell. Its national index, based on a sample of mortgaged homes, showed prices up 2.4% in the year through August.4 That earlier reading also argues against a nationwide price collapse. Neither national measure rules out falling prices in a particular town or neighborhood.
Expensive mortgages are keeping buyers away
To understand why sales are weak, the monthly payment matters as much as the price tag. Most buyers borrowing to purchase a home must fit that payment into their income.
Freddie Mac's average 30-year fixed mortgage rate was 7.11% on November 12, compared with 6.24% a year earlier.5 At a higher mortgage rate, the same loan costs more each month. A buyer therefore needs more income, a larger down payment or a cheaper home to make the payment manageable.
This hypothetical shows what a lower home price or mortgage rate would change. Each purchase uses a 20% down payment and a 30-year fixed mortgage. The down payment is $80,000 on the $400,000 home and $72,000 on the $360,000 home.
| Home price | Mortgage rate | Monthly principal and interest |
|---|---|---|
| $400,000 | 7.11% | $2,153 |
| $360,000 | 7.11% | $1,937 |
| $400,000 | 6.11% | $1,941 |
| $360,000 | 6.11% | $1,747 |
Wealthion calculation. Excludes taxes, insurance, maintenance, association charges and loan fees. Payments are rounded. Lower prices and mortgage rates are illustrations, not forecasts.5
A 10% price cut or a one-percentage-point mortgage-rate reduction each saves just over $200 a month. Together, they save about $406. Cheaper mortgages could bring some buyers back, but they cannot guarantee an affordable payment. Gerli argues that high home prices remain a major obstacle even when financing becomes cheaper.2
Many owners can wait instead of cutting prices
Weak demand does not automatically produce a rush of discounted homes. An owner who can keep paying the bills may postpone moving rather than accept a lower offer.
A cheap existing mortgage adds another reason to stay. Moving could mean replacing it with a loan at today's higher mortgage rate. Economists call this mortgage lock-in. It discourages a purchase, but also keeps the owner's current home off the market.
A Federal Housing Finance Agency study estimated that lock-in prevented 1.33 million sales from the second quarter of 2022 through the end of 2023.6 This is a historical estimate, not a count for 2026. It explains how expensive mortgages can reduce both buyers and sellers, allowing prices to hold up even when sales fall.
Gerli sees more room to wait among financially comfortable owners than among some recent buyers with heavier payments.2 That difference helps determine whether a quiet market stays quiet or produces more price cuts.
Builders have more reason to offer a deal
Unlike owners living in their homes, builders need sales to recover the money committed to land and construction.
At September's sales pace, the 476,000 new single-family homes available would take 8.4 months to sell.7 This includes planned homes and homes under construction, as well as finished houses.8 In October, 43% of builders surveyed by the National Association of Home Builders cut prices and 65% offered sales incentives.9
Zelman describes one such incentive: the builder contributes toward cheaper mortgage financing. The buyer gets a more manageable payment; the builder bears an extra cost, leaving less profit from the sale.3
The terms determine how long that help lasts. An upfront fee, called discount points, can lower the mortgage interest rate.10 A temporary buydown instead pays part of the buyer's initial payments. For mortgages it backs, Fannie Mae requires lenders to assess whether the borrower can afford payments at the loan's full rate.11
If selling finished homes becomes less profitable, builders may also pay less for future building sites. Zelman reports renegotiated land purchases and abandoned deposits.3 A land option allows a builder to pay a deposit for the right to buy lots later. Dream Finders Homes' quarterly filing shows the limits: abandoning a purchase can cost deposits and fees. Some contracts can also leave the builder responsible for managing site work to completion or paying cost overruns.12
Outside investors financing that land may then be left waiting for a buyer. This is how weak home sales can affect investment returns before national house prices fall sharply: incentives reduce builders' profits, while delayed land purchases tie up other investors' money.
A need for housing does not guarantee a sale
It may seem contradictory that builders struggle while people need homes. But needing somewhere to live is different from being able to afford the homes available. A shortage near one city's jobs does not create a buyer for an expensive development elsewhere.
Zelman also expects slower growth in the number of households to reduce future construction needs.3 In its January 2026 outlook, the Congressional Budget Office projects deaths exceeding births from 2030, while immigration continues supporting population growth.13 Those projections do not settle local housing demand. A young adult leaving the family home creates another household without increasing the population. The location, price and type of homes still matter.
What could turn the slowdown into a wider crash
The more serious risk is that sellers lose the ability to wait. Losing a job or falling behind on payments can force an owner to sell. If more homes arrive on a market with too few buyers, sellers may have to accept lower prices.
The mortgage data show some deterioration, but also reasons to distinguish today's slowdown from 2008. In September, 3.66% of loans were at least 30 days overdue, excluding foreclosure, according to Intercontinental Exchange. That was below every pre-pandemic September in its records. Another 0.55% were in foreclosure, and more loans were in that process than a year earlier.14 Foreclosure allows a lender to seek repayment of unpaid mortgage debt through the sale of the property.15 The New York Federal Reserve also reported a growing share of mortgage debt becoming overdue in the third quarter, while describing the overall quality of housing loans as strong.16
Apartment owners face a separate risk. Gerli highlights expiring loans that must be replaced with new loans at higher mortgage rates while rents weaken.2 That can leave less rental income available to meet a larger debt bill. Freddie Mac's measure of troubled apartment loans rose from 0.44% at the end of 2025 to 0.58% on September 30. Its measure covers its own portfolio and includes loans at least two monthly payments overdue or in foreclosure.17
Gerli and Zelman both distinguish their concerns from a repeat of the full 2008 financial crisis.2, 3 Their warnings still matter: property owners and housing businesses can suffer losses without a nationwide banking collapse. Zelman says weakness has reached wealthier buyers who had previously held up better, adding to the difficulties already facing entry-level buyers.3
The risk grows when sellers cannot wait
Lower mortgage rates, rising incomes or lower prices could bring buyers back and ease the slowdown. A deeper downturn becomes more likely if missed payments force more homes onto markets that already have too few buyers.
For now, the national figures show a slowdown, with much sharper weakness in some places. That can still mean losses for homeowners, builders and investors. The risk of a broader crash grows when sellers can no longer afford to wait for buyers to return.
Sources & Disclosure
1 Existing-Home Sales Decreased 5.5% in October, According to NAR Report. National Association of Realtors, November 12, 2026; national and regional October sales, medians and inventory. 2 Housing Market in Crisis: Nick Gerli Warns the Worst Is Yet to Come. Wealthion interview published October 14, 2026 with Maggie Lake. Accompanying Learn article: Are Home Prices Dropping? Nick Gerli Explains the Divide, October 19, 2026. 3 Housing Weakness is spreading to luxury buyers. Wealthion interview with Ivy Zelman, published October 28, 2026 with Maggie Lake. Accompanying Learn article: Why Housing Weakness Is Reaching Wealthier Buyers, November 3, 2026. 4 FHFA House Price Index Up 0.3 Percent in August; Up 2.4 Percent from Last Year. Federal Housing Finance Agency, October 27, 2026; August purchase-only index and repeat-sales methodology. FHFA House Price Index Frequently Asked Questions, updated October 7, 2026, questions 2, 3, 6 and 8; same-property price comparisons and purchase-only sample coverage. 5 Primary Mortgage Market Survey. Freddie Mac, November 12, 2026; weekly 30-year fixed mortgage average and year-earlier comparison. 6 The Lock-In Effect of Rising Mortgage Rates. Ross M. Batzer, Jonah R. Coste, William M. Doerner and Michael J. Seiler, Federal Housing Finance Agency Staff Working Paper 24-03, March 18, 2024; historical model estimates. 7 Monthly New Residential Sales, September 2026, release CB26-174. US Census Bureau and Department of Housing and Urban Development, October 27, 2026; for-sale inventory and months of supply. 8 Survey of Construction: Definitions. US Census Bureau, accessed November 13, 2026; New Houses for Sale, New Houses Sold, Median and Months’ Supply definitions. 9 Builder Sentiment Falls on Rising Rates. National Association of Home Builders, October 19, 2026; October builder survey, price reductions and incentives. 10 How should I use lender credits and points (also called discount points)? Consumer Financial Protection Bureau, accessed November 13, 2026; upfront points and mortgage-rate trade-off. 11 Selling Guide B2-1.4-04, Temporary Interest Rate Buydowns. Fannie Mae, August 7, 2024; qualifying the borrower and permanent note terms, accessed November 13, 2026. 12 Quarterly Report on Form 10-Q for the quarter ended September 30, 2026. Dream Finders Homes, signed November 3, 2026; Note 6, Variable Interest Entities, and Land Acquisition and Development Process, pages 18 and 39; deposits, purchase rights, fees and additional contractual obligations. 13 The Demographic Outlook: 2026 to 2056. Congressional Budget Office, January 2026; population growth, births, deaths and net immigration. 14 ICE First Look: September Delinquencies Track Seasonal Norms as Foreclosure Pipeline Shifts Toward Recent Vintages. Intercontinental Exchange, October 27, 2026; September mortgage-performance table. 15 How does foreclosure work? Consumer Financial Protection Bureau, last reviewed April 3, 2024; foreclosure and recovery of mortgage debt through property sale, accessed November 13, 2026. 16 Household Debt Increased Moderately; Delinquency Transition Rates Remain Flat. Federal Reserve Bank of New York, November 10, 2026; third-quarter housing-debt credit quality and mortgage delinquency transitions. 17 Quarterly Report on Form 10-Q for the quarter ended September 30, 2026. Freddie Mac, filed October 29, 2026; multifamily delinquency rate and delinquency definition.
Wealthion is a dba of Greylock Peak Investments, a registered investment adviser. This article is general information only. It is not investment advice or an offer or solicitation, and it is not tailored to your circumstances. Guests’ views are their own and may not reflect those of Wealthion. Wealthion has not verified guest statements, including any performance figures. Investing involves risk, including loss of principal, and past performance does not guarantee future results. Wealthion refers readers to other registered investment advisers and shares in the fees they receive from referred clients, which creates a conflict of interest. Please see our Form ADV Part 2A and consult your own financial advisor before investing.
What Serious Investors Are Watching
Dive into expert interviews, market analysis, and long-form content built to help serious investors think long-term.

Roth IRA vs Traditional IRA: How They Differ and How to Choose
Roth and traditional individual retirement accounts (IRAs) both help you save for retirement, but they're...

Is the Housing Market Crashing? What the Data Shows
Home sales have fallen sharply, but national prices have held up. Local supply, mortgage payments and sellers’ ability to wait help explain the difference.

Bitcoin vs Ethereum: Key Differences and Investment Risks
Bitcoin (BTC) and ether (ETH) are the two largest cryptocurrencies by market value.1 Both are...
Enjoyed This? Get More Insights
Expert insights and curated opportunities, delivered to your inbox.
Ready to Position for What's Coming?
Whether you're still learning or ready to act, your next step starts here.
- Independent
- Macro-Informed
- Real Asset Focused


The Wealthion Network
By subscribing, you agree to receive Wealthion emails. Unsubscribe anytime.
The Wealthion Network
By subscribing, you agree to receive Wealthion emails. Unsubscribe anytime.
Network Discussion
Join the Wealthion Network to Comment