

What’s Driving AI Stock Volatility in 2026, and What It Means for Investors
Strong earnings do not make an artificial intelligence (AI) stock immune to a sharp fall. Understanding why means looking at what the company earns, what investors expect, and what can force them to sell.
A sharp fall in AI stocks can look like a sign that the story is breaking. But a company can keep growing and still disappoint investors who expected more. To understand the decline, we need to look at what changed in the business, what investors had expected, and whether pressure to sell made the fall larger.
That distinction matters beyond AI funds. The largest AI-linked companies also sit inside widely held indexes, so their swings can reach portfolios that investors may think of as diversified.
Key takeaways
Large daily moves have become more frequent. The semiconductor index has crossed the 5% threshold more often in 2026 than in any year since 2016.1
Expectations matter alongside profits. Concerns about data-center development and disappointing company results help explain why the AI trade has come under pressure.2,3
Borrowing can amplify a decline. Margin calls and daily fund rebalancing can add selling pressure after prices start falling.4,5
Recoveries have taken very different lengths of time. Past index rebounds do not establish when the current decline will end.6,1
How volatile have AI stocks been?
The swings have been particularly pronounced among semiconductor companies. The Philadelphia Semiconductor Index tracks large US-listed companies involved in chips; it is not a measure of AI businesses alone.7
Through November 18, it closed more than 5% higher or lower than the previous trading day on 27 of 222 trading days in 2026. In June and July alone, that happened on 14 of 43 days. The S&P 500 had no such days this year through the same date.1,8
Large daily moves in chip stocks have become more frequent
Share of trading days with a price change greater than 5% in either direction. 2026 through November 18.1,6
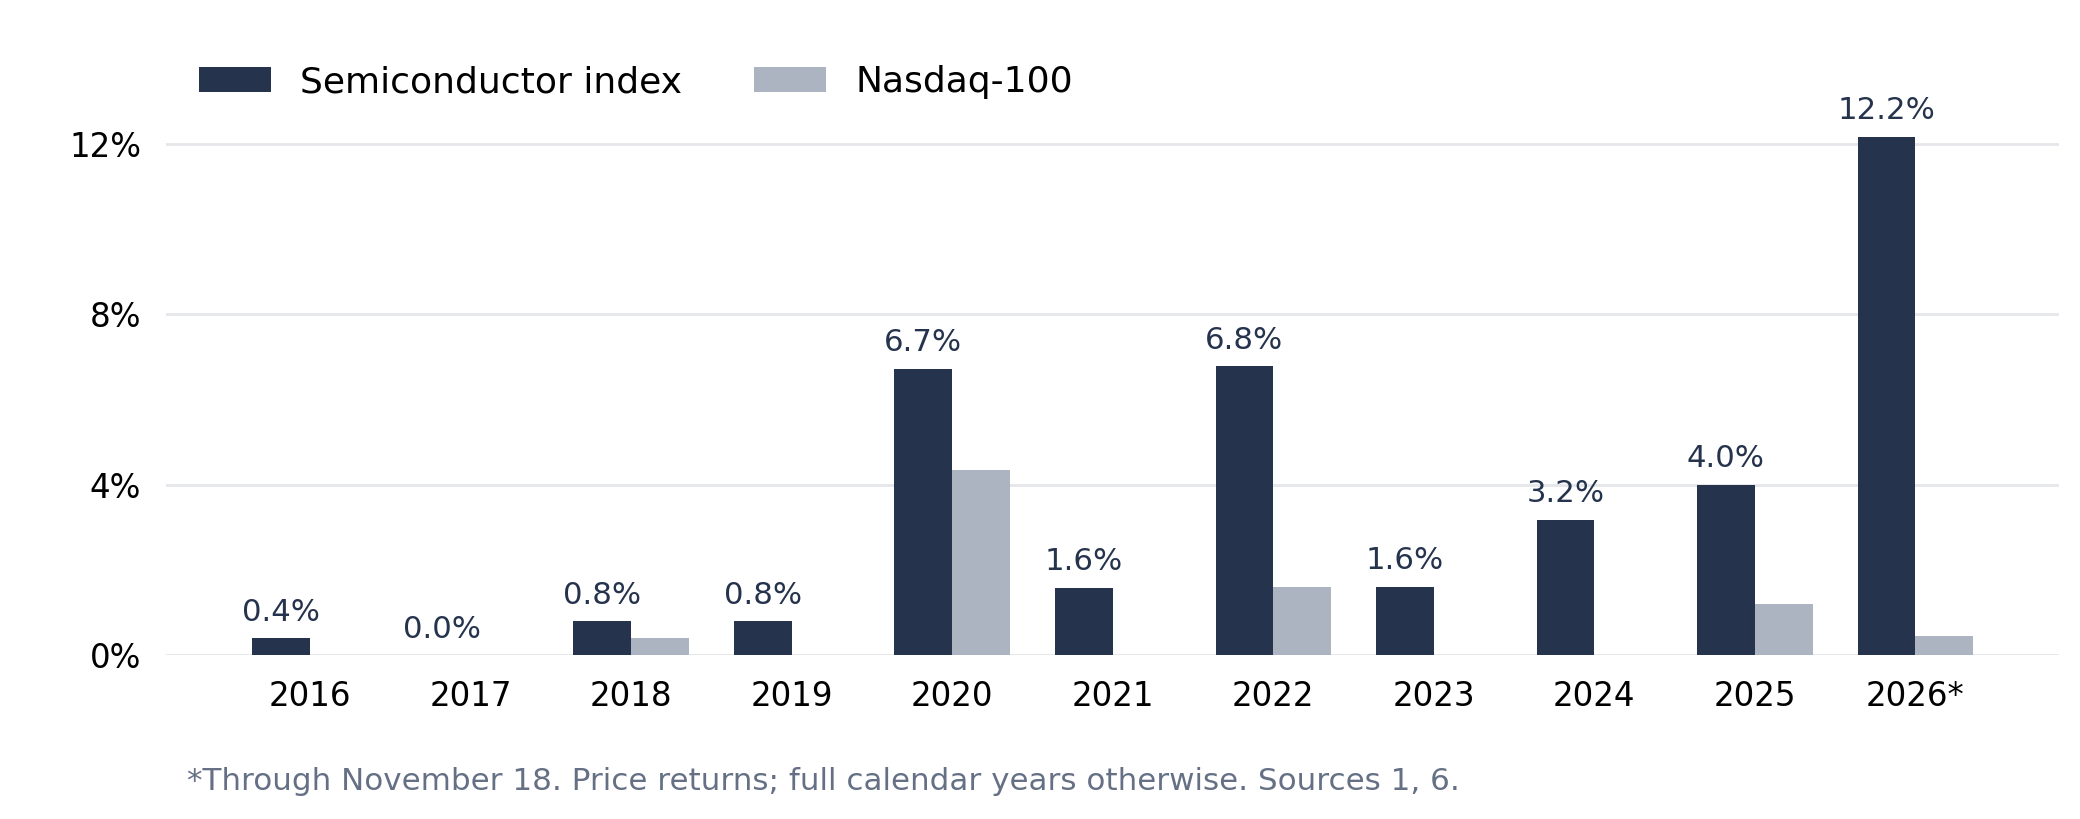
The swings went both ways. The chip index fell 38% from its June 22 closing high to its November 5 low, yet remained up 36% for the year on November 18.1 A large fall from a recent peak and a large gain since January can describe the same investment.
What put AI stocks under pressure?
The November 5 selloff shows how expectations and selling pressure can meet. The chip index fell 12.2% that day.1 Nasdaq's market analysts linked the decline to fears that election results would slow data-center development. They also identified selling by leveraged products and funds that follow price trends as amplifiers.2
The connection to chipmakers is straightforward: a data center that opens later may need its equipment later. Investors can therefore lower what they are willing to pay for a supplier's future earnings before the delay appears in its reported sales. Nasdaq's assessment describes concerns and trading pressure; it does not isolate each factor's contribution to the fall.
Company results were not uniformly strong, either. On November 4, Qualcomm reported quarterly handset revenue down 26% from a year earlier to $5.14 billion, while maintaining its $5 billion data-center revenue target for fiscal 2027.9 Growth prospects in AI can coexist with weakness elsewhere in the same chip business.
A separate earnings-season comparison makes the expectations point clearer. Alphabet, Amazon and Meta reported third-quarter earnings per share below analysts' estimates. Their shares fell an average 7.8% from two days before to two days after their releases.3 The window captures a market reaction around results, not a measurement of losses caused solely by those earnings misses.
Why can growing earnings still disappoint investors?
Growth compares a business with its past. An earnings surprise compares it with what analysts expected. A company can improve on last year and still fall short of that second test.
Technology earnings growth exceeded quarter-start estimates
S&P 500 Information Technology sector, year-over-year earnings growth. Later readings combine reported results with estimates for companies yet to report.10,11,12,3
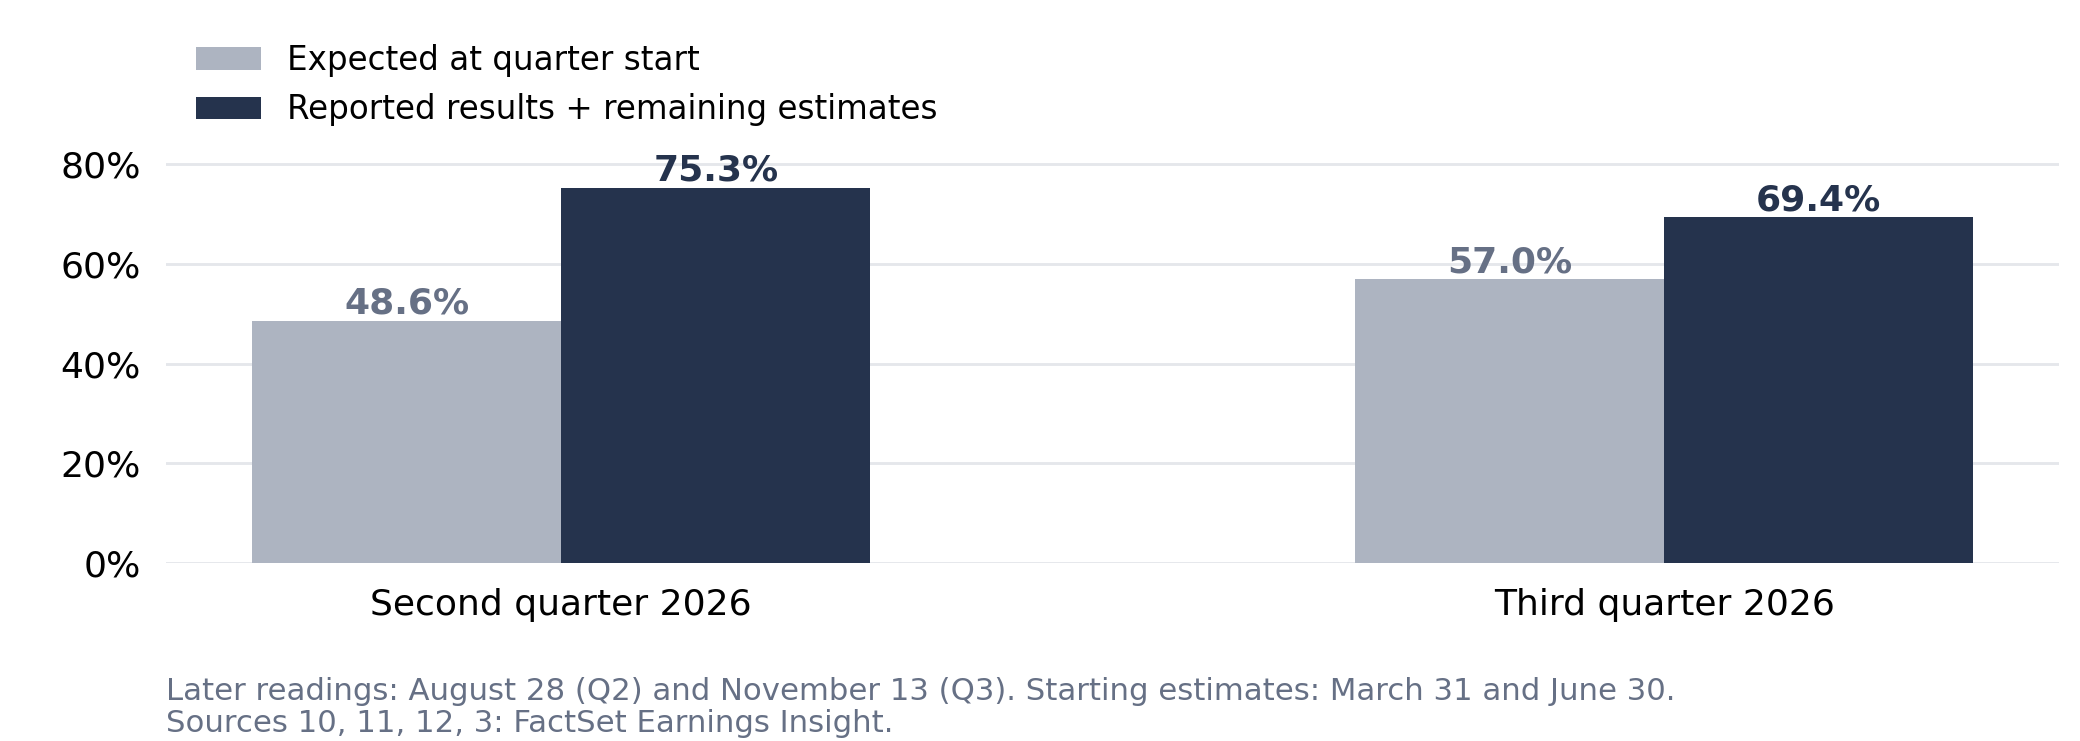
The sector's blended growth rate was 75.3% for the second quarter as of August 28 and 69.4% for the third quarter as of November 13. The semiconductor-and-equipment industry within that sector showed 142% and 133% growth, respectively.11,3 These groups differ from the chip index and do not measure AI-only profits.
Headline profit also needs context. Amazon's third-quarter net income fell about 2%, partly reflecting the absence of a large investment gain recorded a year earlier. Yet operating income rose from $17.4 billion to $28.1 billion.13 The lower net-income figure alone would give an incomplete picture of its business.
Valuation adds another moving part. In the November 13 snapshot, S&P 500 technology shares traded at 18.0 times expected earnings over the next year, below their 10-year average of 23.1.3 That ratio can rise again if earnings estimates fall, even with no change in share prices.
How can borrowing make a fall larger?
Borrowing allows investors to own more than their cash alone would buy. But when prices fall, brokers can demand additional cash or securities, or sell holdings to cover a shortfall. Those sales can add pressure without any further deterioration in the companies being sold.4
The Financial Industry Regulatory Authority (FINRA) reported securities margin debt of $1.50 trillion in June 2026, a nominal record, up from $1.23 trillion at the end of 2025. It stood at $1.45 trillion in October.14 These are market-wide balances, not a measure of borrowing specifically to buy AI stocks.
Hedge funds also entered the period with high leverage: investment exposure enlarged through borrowing or derivatives. The Federal Reserve's gross notional leverage measure, which compares exposure with the funds' net assets, reached its highest level since the data began in 2013 in the first quarter of 2026.5
Daily-reset leveraged and inverse exchange-traded products add another mechanism. They aim to multiply or reverse a day's market move and adjust their exposure to maintain that target. The Fed's November report put assets in equity-linked products of this type above $170 billion and warned that rebalancing can amplify declines.5
In a November 11 Wealthion interview, Steve Hanke, professor of applied economics at Johns Hopkins University, described “a huge credit expansion” alongside “a huge increase in market cap,” or stock-market value.15 His assessment and the broader leverage figures help explain vulnerability; they do not identify who sold during every AI-stock decline.
What do previous falls tell us about recovery?
Similar-sized falls have been followed by very different waits. This table measures recovery from the original peak, including the time spent falling.6,1
| Episode | Nasdaq-100: fall / recovery time | Chip index: fall / recovery time |
|---|---|---|
| Dot-com bust, 2000–2002 | −83% / More than 15 years | Not covered by this data series |
| Financial crisis, 2007–2009 | −54% / About 3 years | −69% / About 6.5 years |
| 2018 | −23% / About 8 months | −26% / Just over a year |
| Pandemic, 2020 | −28% / Under 4 months | −35% / Under 4 months |
| 2022 | −36% / About 2 years | −46% / About 2 years |
| 2026 so far | −15% / Not yet regained | −38% / Not yet regained |
Closing-price indexes, excluding dividends. Recovery means the first close at or above the previous peak. Current episode through November 18, 2026.6,1
The completed episodes shown eventually recovered, but the current one had not. An index can also recover with different companies in it; its rebound does not establish that every original holding recovered.16 The table gives perspective on waiting time, not a timetable for the next rebound.
Why does this matter beyond AI funds?
An index fund can hold some of the same companies as a dedicated AI fund. Rupert Mitchell, a global macro investor, argued in an October interview that “the lazy index exposure has never been more focused on a single bet than it has done right now.”17
The degree of exposure still matters. Through November 18, the Nasdaq-100 had only one day with a move exceeding 5% in either direction. Its annualized historical volatility was about 22%, against 50% for the chip index and 14% for the S&P 500.6,1,8 These figures summarize daily price variability, not annual returns or forecasts.
What does this mean for investors?
A company can keep growing while its shares fall. Investors may have expected more, become less willing to pay for future profits, or faced pressure to sell. More than one explanation can apply at once.
The evidence points to concerns about future AI expansion, uneven company results and trading that can magnify a decline. It does not support treating every fall as forced selling, or every growing business as a stock that must recover. The useful distinction is between what the business has delivered, what its price had assumed, and how that exposure reaches the investor's portfolio.
Frequently asked questions
Why can a stock fall after earnings grow? Growth from last year may still disappoint expectations, or investors may become less confident about future profits. The latest quarter is only part of what a share price reflects.
Is the semiconductor index an AI index? No. Its 30 companies are involved in designing, distributing, manufacturing or selling semiconductors. Their businesses can serve markets beyond AI.7
Does high margin debt prove forced selling caused a decline? No. It measures borrowing in securities accounts. Establishing forced selling in a particular episode requires evidence about the actual transactions and funding pressures.14,4
Does a lower earnings multiple mean stocks are safe? No. A multiple based on forecast earnings depends on those forecasts being achieved. A lower ratio does not remove business risk or guarantee a recovery.
Sources & Disclosure
1 PHLX Semiconductor Index (NASDAQSOX). Nasdaq daily closes distributed by the Federal Reserve Bank of St. Louis (FRED), through November 18, 2026. Wealthion calculations: absolute daily price returns greater than 5%, peak-to-trough declines, recovery dates and annualized sample standard deviation of daily returns using 252 trading days. 2 AI theme concerns accelerate market rotation as the cycle ages. Yanni Angelakos, Mike Cho and Zyra Cariaga, Nasdaq, November 13, 2026; attributed analysis of the November 5 selloff, development concerns and deleveraging. The authors acknowledge uncertainty over the initial trigger. 3 Earnings Insight. FactSet, November 13, 2026, pp. 1, 3, 7, 12–14 and 34; blended earnings growth, earnings surprises and associated price windows, accounting effects, and forward valuation. Results and estimates are combined for the earnings-growth aggregates. 4 Investor Bulletin: Understanding Margin Accounts. US Securities and Exchange Commission, June 10, 2021; margin borrowing, collateral demands and broker liquidation rights. 5 Financial Stability Report. Federal Reserve Board, November 13, 2026, printed pp. 34–35 and 58; hedge-fund gross notional leverage including derivatives, and potential price amplification from leveraged and inverse exchange-traded products. 6 Nasdaq-100 Index (NASDAQ100). Nasdaq daily closes via FRED, through November 18, 2026; Wealthion calculations using the same methods. The non-trading-day observation for Good Friday, April 19, 2019, is excluded. 7 PHLX Semiconductor (SOX) index overview. Nasdaq Global Indexes, accessed November 20, 2026; 30-company index and eligible semiconductor activities. 8 S&P 500 (SP500). S&P Dow Jones Indices daily closes via FRED, through November 18, 2026; Wealthion daily-return and annualized-volatility calculations. 9 Qualcomm Announces Fourth Quarter and Fiscal 2026 Results. November 4, 2026, pp. 1–2, Form 8-K Exhibit 99.1; quarter ended September 27, handset revenue and fiscal 2027 data-center revenue target. 10 Earnings Insight. FactSet, July 2, 2026, p. 11; second-quarter technology earnings-growth estimate at March 31. 11 Earnings Insight. FactSet, August 28, 2026, pp. 1 and 12; second-quarter blended technology and semiconductor-and-equipment earnings growth. 12 Earnings Insight. FactSet, October 2, 2026, p. 11; third-quarter technology earnings-growth estimate at June 30. 13 Amazon.com Announces Third Quarter Results. Amazon, October 29, 2026; quarter ended September 30, operating income, net income and the prior-year Anthropic investment gain. 14 Margin Statistics. Financial Industry Regulatory Authority, accessed November 20, 2026; monthly debit balances in customers’ securities margin accounts, in millions of US dollars. 15 Steve Hanke Warns: A Financial Crisis Could Send Stocks Down 40%. Wealthion interview, video published November 11, 2026; transcript passage on credit expansion and market capitalization. Guest assessment is attributed. 16 Nasdaq-100 Index Methodology. Nasdaq, 2026, pp. 1 and 5–9; index scope, constituent deletion and replacement. 17 Your Portfolio Is One Big AI Bet: The Diversification Illusion. Wealthion interview with Rupert Mitchell, video published October 5, 2026; transcript passage on index concentration.
Wealthion is a dba of Greylock Peak Investments, a registered investment adviser. This article is general information only. It is not investment advice or an offer or solicitation, and it is not tailored to your circumstances. Guests’ views are their own and may not reflect those of Wealthion. Wealthion has not verified guest statements, including any performance figures. Investing involves risk, including loss of principal, and past performance does not guarantee future results. Wealthion refers readers to other registered investment advisers and shares in the fees they receive from referred clients, which creates a conflict of interest. Please see our Form ADV Part 2A and consult your own financial advisor before investing.
What Serious Investors Are Watching
Dive into expert interviews, market analysis, and long-form content built to help serious investors think long-term.
What’s Driving AI Stock Volatility in 2026, and What It Means for Investors
AI-stock declines can reflect changing profit expectations and selling pressure. Company results, leverage data and past recoveries help explain the differences.

Is Gold Still a Safe Haven in 2026? What It Protects Against and Its Role in a Portfolio
Gold can help protect wealth in different ways, but its price can still fall sharply. Historical evidence explains the roles, limits and importance of the purchase price.

Macro Bites – Global Leaders Meet as Copper Falls and Fed Eyes Hikes
On Thursday, Presidents Trump, Xi and Putin conducted the first-ever trilateral meeting between the world’s...
Enjoyed This? Get More Insights
Expert insights and curated opportunities, delivered to your inbox.
Ready to Position for What's Coming?
Whether you're still learning or ready to act, your next step starts here.
- Independent
- Macro-Informed
- Real Asset Focused


The Wealthion Network
By subscribing, you agree to receive Wealthion emails. Unsubscribe anytime.
The Wealthion Network
By subscribing, you agree to receive Wealthion emails. Unsubscribe anytime.
Network Discussion
Join the Wealthion Network to Comment