

Average 401(k) Contributions: What the Numbers Really Tell You
Average 401(k) contribution figures are widely quoted, but they don’t all measure the same thing. For savers, the value lies in knowing which figure to set beside their own.
You’re putting 6% of your pay into a 401(k). Then a headline says the average savings rate is around 12%. Suddenly, a habit you felt good about looks like half an effort.
Before that comparison means anything, one question needs answering: whose money is in the 12%?
It may include the employer’s contribution. It may also describe a group of savers with different salaries, ages and working histories. None of that makes the number useless. It changes what the number can tell you.
Start with the numbers themselves. One large study estimates that employees put an average of 7.6% of pay into their 401(k) in 2025. Add employer contributions, and the average total savings rate was 12.1%. Both figures come from Vanguard’s How America Saves 2026 and describe participants in the plans it administers, rather than all American workers. This article explains what averages like these include, who they leave out and how to read your own rate against them. 1
One paycheck, two savings rates
The employee deferral rate is the share of pay a worker puts into the plan through pre-tax or Roth contributions. The total savings rate also counts employer money, including matching contributions and contributions the employer makes without requiring an employee contribution.
Imagine a worker earning $60,000 who contributes 6% all year. The employer matches 50 cents for every dollar contributed, up to the first 6% of pay. Here is what that hypothetical arrangement produces:
The same saver can have a 6% contribution rate and a 9% total savings rate
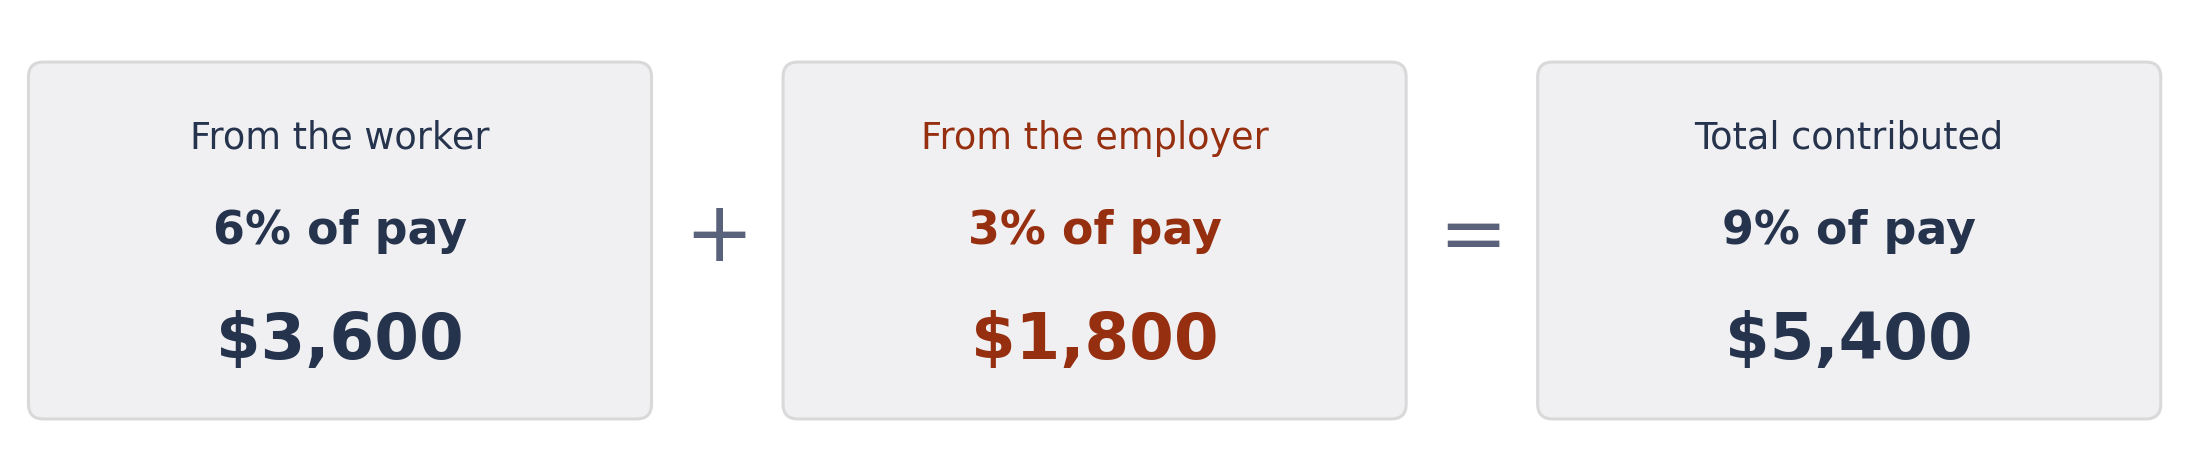
Hypothetical annual example. Salary and contribution rates stay constant; all salary is eligible for the match. Amounts show contributions only, excluding investment gains, losses and fees. This is an illustration, not a suggested savings rate.
The worker has $3,600 withheld from pay, while $5,400 goes into the account. Comparing that worker’s 6% with another person’s employee-plus-employer total would mix two different measures.
The match formula matters too. Another employer could contribute the same 3% of pay by matching dollar for dollar on the first 3%. The employer’s maximum is identical, but the employee contribution needed to receive it is different. A promised match describes the plan’s offer, not necessarily what each worker receives.
What the published averages actually say
That distinction explains part of the variation across headlines. The rest comes from whose plans are measured and when.
| Source and period | Employee rate | Employee + employer |
|---|---|---|
| Vanguard: 2025, estimated 1 | 7.6% | 12.1% |
| Plan Sponsor Council of America: 2024 2 | 7.7% | 12.5% |
| Fidelity: June 30, 2026 3 | 9.6% | 14.4% |
Reported average contribution rates in each source’s covered plans. Different populations, methods and periods make these comparisons descriptive, not a time series.
The typical saver put in less than the average. Vanguard’s median employee rate was 6.6%, below its 7.6% average. The median is the middle saver when rates are arranged from lowest to highest; higher rates pull the average upward. 1
These are different groups of savers, so the gap between Vanguard’s 7.6% and Fidelity’s 9.6% doesn’t mean anyone raised their contributions. No single provider’s average is a national savings rate.
Vanguard’s 2025 contribution figures are estimates. They come from a subset of its clients and early plan-testing data, and the information needed to finalize them will not be available until December 2026. 1
Within Vanguard’s series, the average total rate rose from 10.4% in 2016 to an estimated 12.1% in 2025. That provides a longer view of saving across its plans, though changes in the people and employers covered can also affect the comparison. 1
Age and income change the comparison
An overall average puts someone starting a first job alongside someone nearing retirement. Splitting the figures by age makes that difference visible.
Older participants saved a larger share of pay
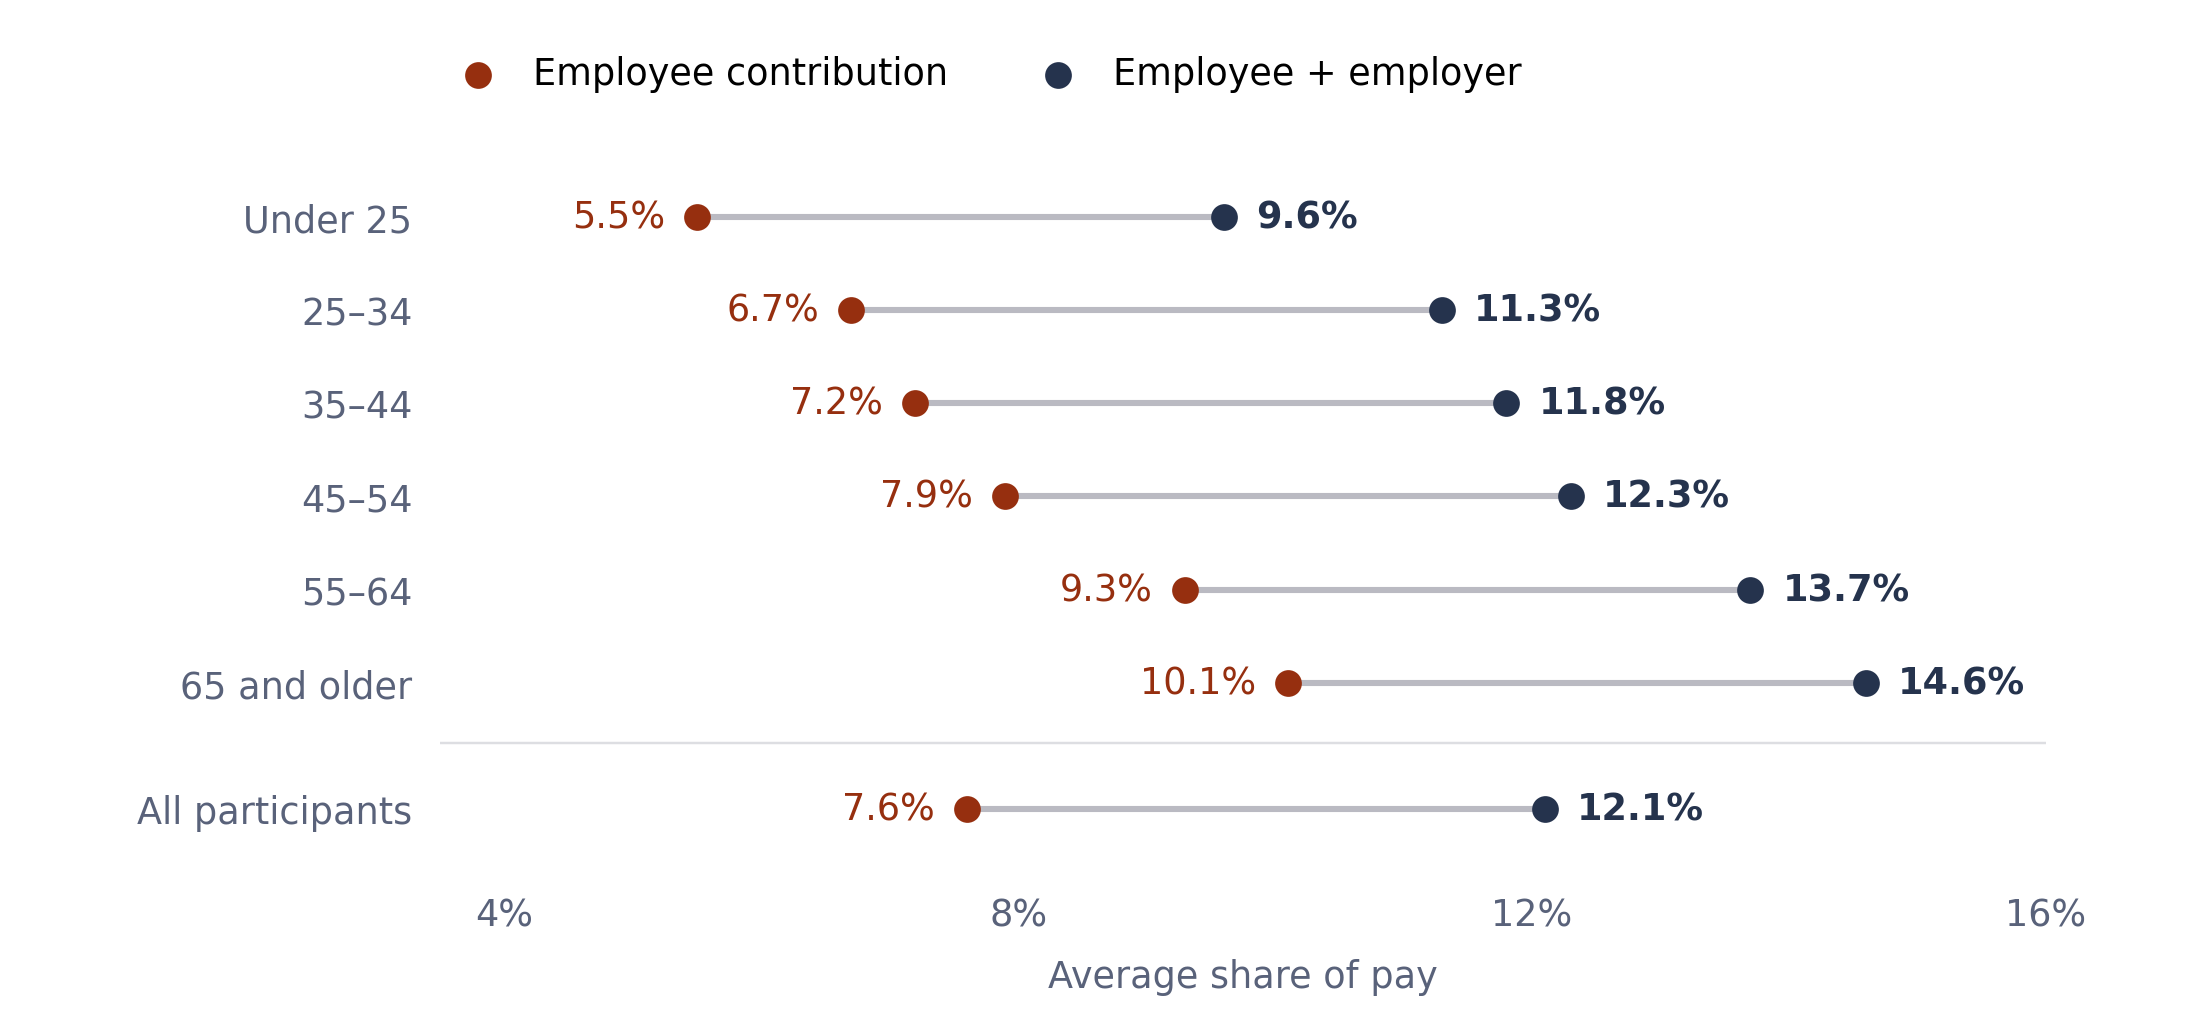
Source: Vanguard, How America Saves 2026, Figures 31 and 46. Average rates for 2025, estimated; participants only. These are different age groups observed in the same year, not one group followed through life. 1
Both measures rise across the age bands, and employer money adds substantially in every group. The chart shows what each age group saved, which is different from what anyone ought to save at each birthday. Age also comes with other differences, including income and time with an employer.
Income adds a wrinkle. Vanguard’s estimated employee rate rose from 5.7% among participants earning $15,000 to $29,999 to 9.0% at $100,000 to $149,999, then slipped to 8.6% at $150,000 or more. 1
A fixed dollar amount becomes a smaller percentage as pay rises. For example, $20,000 equals 20% of a $100,000 salary but only 8% of a $250,000 salary. Once someone reaches a dollar contribution limit, higher pay can lower the rate without reducing the dollars saved.
The people missing from the average
Even a comparison with people of similar age and income can leave out an important group: employees saving nothing.
Vanguard’s headline rates exclude eligible employees who do not contribute. Include those nonparticipants at zero, and the estimated average total savings rate falls from 12.1% to 10.2%. No participant has changed a contribution. The calculation simply counts more people. 1
The wider workforce includes people without access to a plan at all. In March 2026, 72% of private-industry workers had access to retirement benefits and 52% participated, according to the Bureau of Labor Statistics. Those figures include traditional pensions as well as 401(k)-style plans, so they describe a broader group than the contribution table. 4
Plan design helps determine who appears among the savers. With automatic enrollment, employees start contributing unless they opt out. Vanguard estimated participation at 94% for employees under automatic enrollment, compared with 64% in voluntary-enrollment plans in 2025. Enrollment may not explain the whole gap. 1
Wider participation can even pull an average down. Picture ten employees on the same pay. Five save 10% and five save nothing, so the average among savers is 10%. Now the other five start saving 3%. Twice as many people are saving and more money is going in, but the average among savers drops to 6.5%. In this made-up example, pay and the first five’s rates stay the same and employer money is left out. A lower average can sometimes go with more saving.
The average therefore reflects more than personal resolve. It also reflects access to a workplace plan and how that plan is set up.
A balance answers a different question
Contribution rates show what is going in. Account balances show what has accumulated, including investment results. Confusing them turns a snapshot of saving behavior into a verdict on retirement readiness.
In Vanguard’s 2025 data, the average balance was $167,970, while the median was $44,115. A relatively small number of large accounts can pull the average far above the middle account. 1
A current employer’s plan may also hold only part of someone’s retirement savings. Money from earlier jobs can sit elsewhere. Two people with the same current-plan balance may have very different total savings, just as two people contributing the same percentage may be putting away very different dollar amounts.
Where the 2026 and 2027 limits fit
The Internal Revenue Service (IRS) limits answer another question: how much the rules allow. They do not describe what most people contribute.
| Employee contribution limit | 2026 5 | 2027 6 |
|---|---|---|
| Regular deferral limit | $24,500 | $25,500 |
| Additional catch-up, ages 50–59 or 64+ | $8,000 | $8,500 |
| Additional catch-up, ages 60–63 | $11,250 | $11,750 |
Standard 401(k) limits; certain small-business plans have separate limits. Age is measured at year-end. Catch-ups depend on plan provisions; the enhanced amount replaces the regular catch-up. Plan-specific restrictions can lower permitted contributions. 7
An employer match does not use up the employee deferral limit. It counts toward a separate combined ceiling covering regular employee and employer contributions: $72,000 for 2026 and $75,000 for 2027, or 100% of compensation if lower. Catch-up contributions sit outside that ceiling. 7, 8
That distinction brings the discussion back to the paycheck. The amount a worker elects to save, the employer’s addition and the legal maximum are separate numbers. Each answers a different question.
How to read an average
There is value in knowing what other savers contribute. Before setting a published figure beside your own, three questions help.
Whose money is counted? Employee contributions alone, or employee and employer contributions together.
Which people are counted? Savers in one provider’s plans, with or without the employees who contribute nothing.
Which period? A final figure, an estimate or a single date.
Take the saver putting away 6% at the start of this article. Set beside a 12% figure that includes employer money, 6% looked like half an effort. Set beside other employees’ own contributions in the same Vanguard data, it is just under the 6.6% median and below the 7.6% average. The saving hasn’t changed. The comparison has.
For an investor, that is the takeaway. An average describes other people’s contributions, measured in a particular way, and it is useful once you know what it measures. Whether your own saving will support retirement depends on things no average contains: the assets you already have, the time ahead of you and what you expect to spend.
Sources & Disclosure
1 Vanguard, How America Saves 2026, June 2026. 2025 employee and total contribution estimates, age and income comparisons, enrollment, balances and methodology; Figures 27, 29, 31, 44–47 and 50; pp. 22–23, 35–38, 45–50 and 109. 2 Plan Sponsor Council of America, PSCA Annual Survey: Participation Climbs as Employers Embrace SECURE 2.0 Flexibility, November 12, 2025. 68th Annual Survey, 2024 plan year; 755 401(k) plans; employee and employer contribution rates. 3 Fidelity Investments, Q2 2026 Retirement Analysis, data as of June 30, 2026. Corporate defined contribution plans; employee savings rate of 9.6% and total of 14.4%; methodology and exclusions. 4 U.S. Bureau of Labor Statistics, Employee Benefits in the United States, March 2026, September 25, 2026, Table 1 and Technical Note. Private-industry retirement benefit access and participation. 5 Internal Revenue Service, 401(k) limit increases to $24,500 for 2026, IRA limit increases to $7,500, November 13, 2025. Regular and age-based catch-up limits for 2026. 6 Internal Revenue Service, 401(k) limit increases to $25,500 for 2027, IRA limit remains $7,500, November 12, 2026. Regular and age-based catch-up limits for 2027. 7 Internal Revenue Service, Retirement Topics: 401(k) and Profit-Sharing Plan Contribution Limits, accessed November 16, 2026. Plan restrictions, year-end age, catch-ups and annual-additions rules. 8 Internal Revenue Service, Notice 2026-66, 2027 Amounts Relating to Retirement Plans and IRAs, November 2026, p. 1. Annual-additions limit of $75,000 for 2027, increased from $72,000.
Wealthion is a dba of Greylock Peak Investments, a registered investment adviser. This article is general information only. It is not investment advice or an offer or solicitation, and it is not tailored to your circumstances. Guests’ views are their own and may not reflect those of Wealthion. Wealthion has not verified guest statements, including any performance figures. Investing involves risk, including loss of principal, and past performance does not guarantee future results. Wealthion refers readers to other registered investment advisers and shares in the fees they receive from referred clients, which creates a conflict of interest. Please see our Form ADV Part 2A and consult your own financial advisor before investing.
What Serious Investors Are Watching
Dive into expert interviews, market analysis, and long-form content built to help serious investors think long-term.

An AI Portfolio Stress Test: What If the Spending Boom Slows?
An artificial intelligence (AI) spending slowdown could reach well beyond technology shares. Suppliers, data-center landlords...

Rising Bond Yields: What They Mean for Your Bonds, Your Stocks and the AI Trade
Higher bond yields affect existing bonds, new income, stock valuations and the cost of financing AI infrastructure. The impact depends on what investors own and how companies fund their spending.

Macro Bites – Fed Rate Debate Intensifies as Metals Markets Tighten
CNN reports U.S. intelligence indicates Iran may be developing plans to target senior Trump administration...
Enjoyed This? Get More Insights
Expert insights and curated opportunities, delivered to your inbox.
Ready to Position for What's Coming?
Whether you're still learning or ready to act, your next step starts here.
- Independent
- Macro-Informed
- Real Asset Focused


The Wealthion Network
By subscribing, you agree to receive Wealthion emails. Unsubscribe anytime.
The Wealthion Network
By subscribing, you agree to receive Wealthion emails. Unsubscribe anytime.
Network Discussion
Join the Wealthion Network to Comment