

Bond Ladders Explained: How Staggered Maturities Work
A bond ladder spreads one sum across bonds that mature in different years, so cash comes back on a schedule you set. It doesn't remove interest rate risk. It changes how often you meet it.
What is a bond ladder and how does it work?
A bond ladder holds bonds with different maturity dates. Maturity is the date an issuer is scheduled to repay face value, the amount on which interest is calculated. A single five-year Treasury note bought at par with $100,000 pays interest every six months, then returns $100,000 at maturity1,2. The market rate matters when that principal is reinvested; it does not change the repayment amount.
A ladder spreads those principal repayments across several dates. That also spreads future reinvestment decisions, which can work for or against its income depending on where rates go next.
A ladder works like a staircase of repayment dates. A common version splits the money into equal parts and buys a bond for each step, called a rung. As each rung matures, that slice of money comes back.
The hypothetical below uses five fixed-rate bonds with $20,000 face value each, maturing one year apart from November 2027 to November 2031. Each is assumed bought at par, meaning face value, with interest paid every six months and no calls or defaults. Coupon rates, the rates paid on face value, are set equal to Treasury yield inputs for November 6, 20263,4. These are modeling assumptions, not quotes for actual securities. Longer bonds generally carry more interest rate risk, the chance that rising market rates cut a bond's price5.
| Rung | Matures | Modeled coupon rate | Yearly interest | Principal returned |
|---|---|---|---|---|
| 1 | Nov 2027 | 4.33% | $866 | $20,000 |
| 2 | Nov 2028 | 4.51% | $902 | $20,000 |
| 3 | Nov 2029 | 4.59% | $918 | $20,000 |
| 4 | Nov 2030 | 4.62% | $924 | $20,000 |
| 5 | Nov 2031 | 4.64% | $928 | $20,000 |
Hypothetical par coupon-bond model, not a quote. Inputs: Federal Reserve3; four-year rate is the rounded midpoint of three-year and five-year yields. The one-year rung is a coupon-paying bond, not a Treasury bill. Initial annual interest totals $4,538, averaging 4.54%.
In this model, interest arrives every six months while a bond is outstanding. Principal arrives once, at maturity, as face value. The single five-year comparison note returns all $100,000 in November 2031. The ladder returns $20,000 each year during the five-year illustration. If each payment is reinvested in a new five-year rung, one fifth of its face value remains due within a year.
Principal repayments from the ladder and the single five-year note
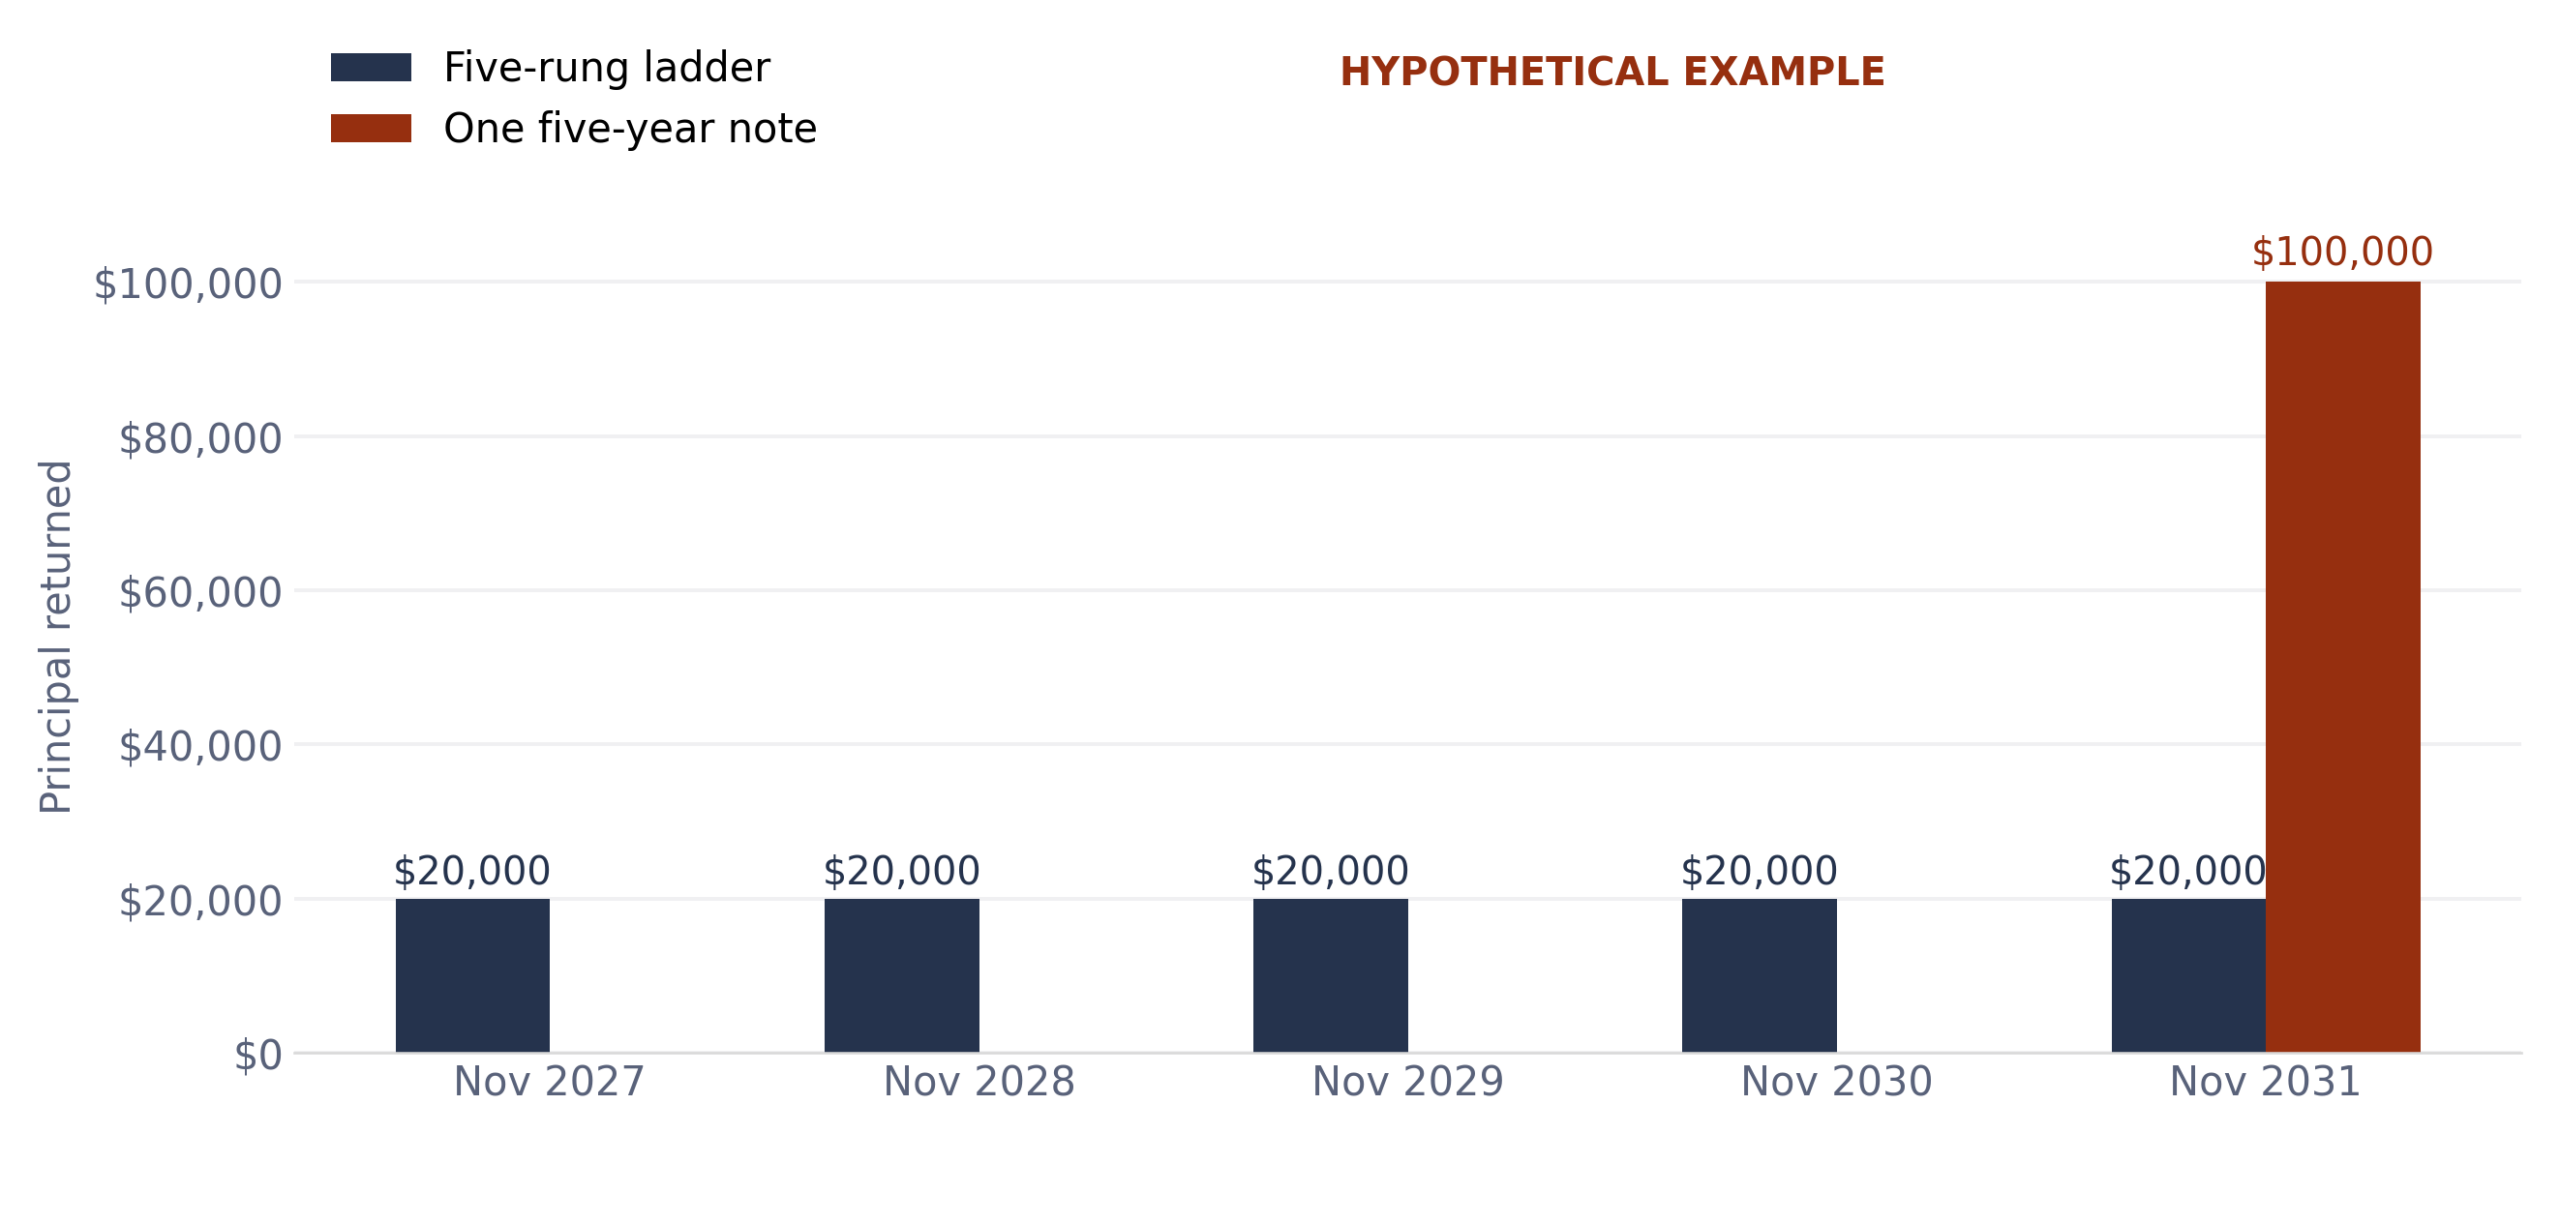
Hypothetical example: $100,000 bought November 2026. Principal only; interest excluded.
How the maturity schedule is set
Maturity dates can be matched to expected cash needs. In the hypothetical, $20,000 of planned spending each November for five years could be matched with a rung due just before each payment.
Length and rungs. The last rung's maturity sets the length. There is no official number of rungs: more mean smaller pieces and more maturity dates, fewer mean bigger reinvestment decisions.
The securities available matter. Treasury sells new notes for terms of 2, 3, 5, 7 or 10 years1 and bills for up to 52 weeks6. A bill's interest is the difference between purchase price and face value, paid at maturity. An existing note with about one year left can provide a coupon-paying first rung. A four-year rung also comes from the secondary market, where existing securities trade between investors7,8.
At each maturity, the principal can be spent, rolled into a new five-year note that becomes the top rung, or reinvested for a shorter term, shortening the ladder. After five annual replacements with five-year notes, every rung was bought in a different year. Under the model's equal-face-value and par-purchase assumptions, its annual coupon income then reflects the average of those five purchase-year rates.
What are the benefits and costs of a bond ladder?
A ladder returns money on a schedule and spreads reinvestment across several dates, so you don't have to guess where rates are heading. What it costs depends on the yield curve, the line that plots yields against maturity.
On November 6, 2026 that line sloped gently upward, so shorter rungs paid less. The ladder starts at an average of 4.54%, against 4.64% for one five-year note, about $102 less a year on $100,000. If maturing rungs are reinvested at 4.64%, the income gap closes gradually and the ladder gives up about $160 over five years. A steeper starting curve would widen the initial gap; an inverted one, with short yields above long, would reverse it.
Reinvestment risk is the chance that when money comes back, the rate on offer is lower than the one it earned before. The single note returns all $100,000 for principal reinvestment in November 2031. The ladder returns it across five dates. Suppose the five-year rate moves two percentage points right after purchase and stays there, and each rung rolls into a new five-year note at that rate.
| New five-year rate | Ladder interest, year 5 | Single note interest, year 5 | Ladder minus single, years 1 to 5 |
|---|---|---|---|
| Falls to 2.64% | $3,040 | $4,640 | -$4,160 |
| Stays at 4.64% | $4,640 | $4,640 | -$160 |
| Rises to 6.64% | $6,240 | $4,640 | +$3,840 |
Hypothetical scenarios; Wealthion arithmetic on the example above. Excludes taxes, trading costs and reinvestment of interest.
Both readings are fair. The cautious one: when rates fall, the ladder trails, because it reinvests early at lower rates while the single note keeps 4.64% to the end. The favorable one: when rates rise, the ladder pulls ahead, because it meets higher rates sooner.
How annual interest changes as the bonds mature and are replaced
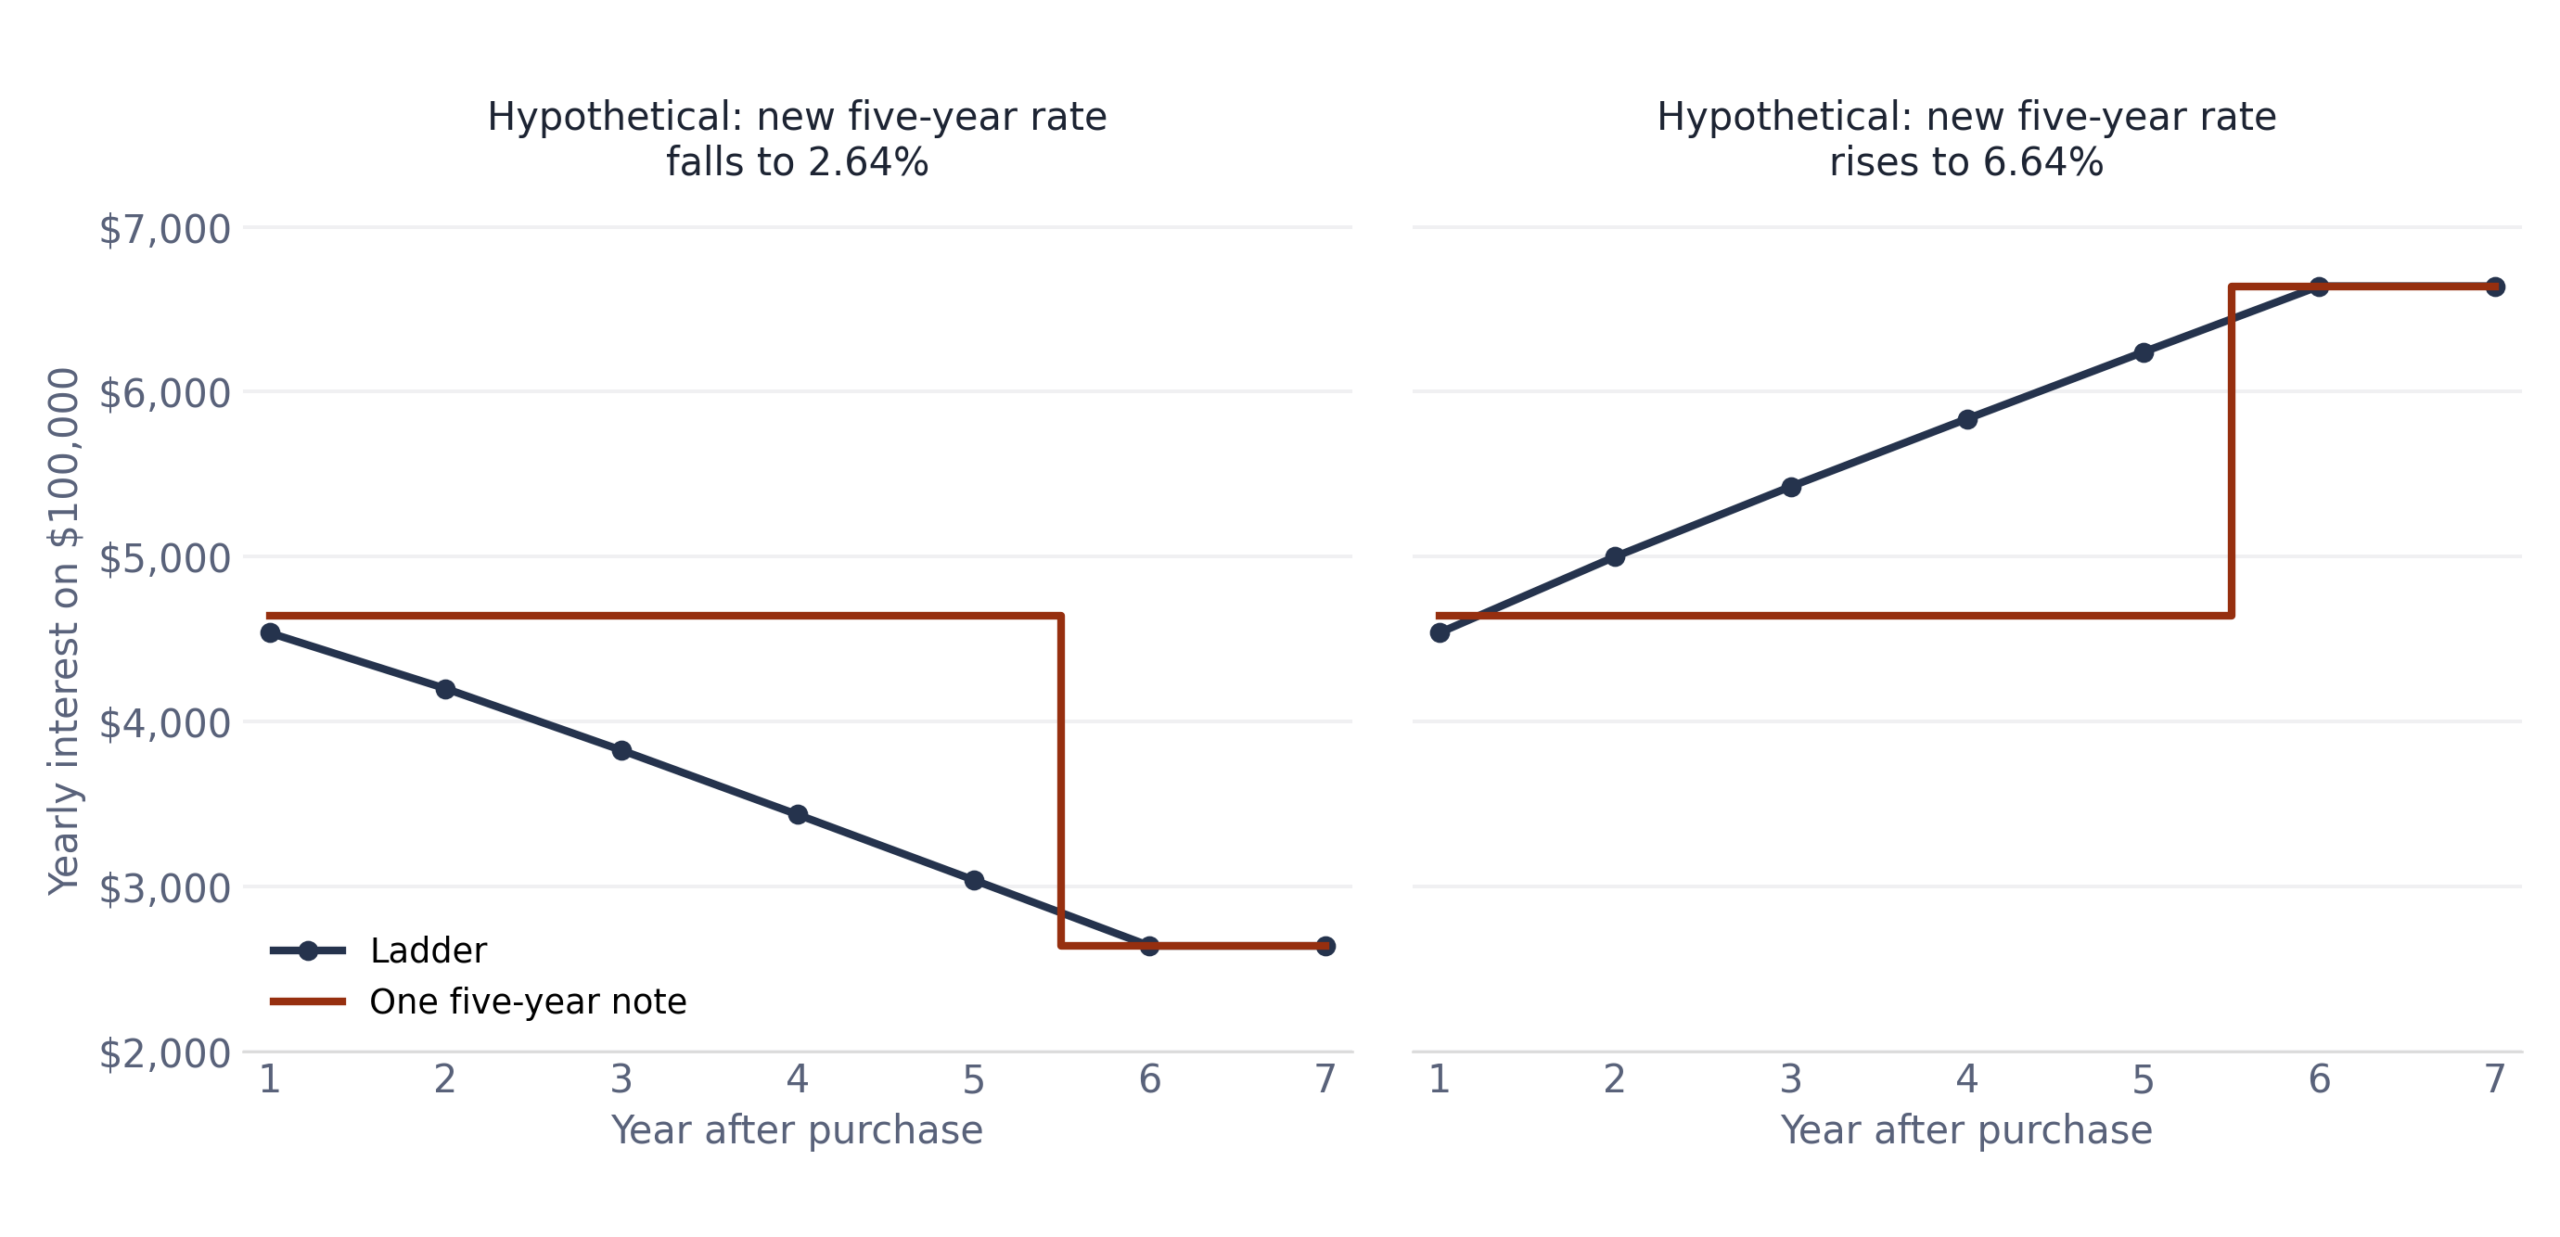
Hypothetical scenarios: yearly interest on $100,000. Wealthion arithmetic.
What happens if you need to sell a rung early?
An early sale receives the market price rather than the maturity payment. A Treasury note held to maturity pays its stated interest and face value5. Selling before then can produce a price above or below the purchase price.
This is the other side of the rate tradeoff. Falling rates can reduce the income available when principal is reinvested; rising rates can reduce the price received in an early sale. Holding to maturity avoids realizing that rate-driven price loss, while leaving the future reinvestment rate unknown.
The United States Securities and Exchange Commission (SEC) illustrates the swing. A $1,000 bond paying 3% is priced at $925 a year later if rates have risen to 4% with nine years left, and $1,082 if they have fallen to 2%5.
Maturity affects the size of the price change. If each rung's market yield rose by one percentage point immediately after purchase, its modeled value would be:
| Rung | Value after a one-percentage-point rise | Change |
|---|---|---|
| 1 year | $19,808 | -$192 |
| 2 years | $19,626 | -$374 |
| 3 years | $19,455 | -$545 |
| 4 years | $19,292 | -$708 |
| 5 years | $19,139 | -$861 |
Hypothetical coupon-bond model; Wealthion arithmetic, semiannual interest, bought at par. The same method reproduces the SEC's $925 and $1,082. Excludes dealer spreads.
The whole ladder would be down about $2,680, against about $4,305 for one $100,000 five-year note, and close to the roughly $2,730 loss on one three-year note, the ladder's average maturity. The dollar effect depends on both the rung's remaining maturity and how much is sold.
Selling a Treasury means working through a bank, broker or dealer, and a security bought on TreasuryDirect must be held there 45 days first9.
Does a bond ladder protect against every risk?
No. Spacing the maturities spreads the timing of reinvestment. It does not remove call, credit or inflation risk.
Call risk. Many bonds are callable, meaning the issuer can repay them before maturity10. A called investor is often left reinvesting at a lower rate11. Issuers can save money by calling when rates fall10, so a callable rung can disappear before its planned repayment date. Call provisions are common in corporate and municipal bonds11.
Credit risk. In a corporate or municipal ladder, an issuer that fails to repay can interrupt payments and cost principal. Spacing the dates does not prevent that12.
Inflation. A Treasury note's interest rate is fixed at auction1. Rising prices reduce what its fixed interest payments and principal can buy12. That erosion occurs even when inflation remains below the coupon rate. Treasury Inflation-Protected Securities (TIPS) adjust principal for inflation, but new ones are sold only in 5, 10 and 30 year terms13.
A ladder turns one principal repayment date into several. In the hypothetical, its initial annual interest was about $102 lower than the single five-year note's. It spread principal reinvestment across five dates and its modeled early-sale loss was more than a third smaller than that five-year note's loss. That comparison also reflects its shorter average maturity: the three-year note had a similar loss. The schedule spreads the timing of reinvestment without ensuring a better outcome.
Frequently asked questions
Is a bond ladder the same as a bond fund? No. A ladder holds individual bonds that each repay face value on a set date. A conventional, ongoing bond fund generally keeps replacing its bonds, so it has no maturity date for your principal.
Is Treasury note interest taxed? In a taxable account, federal income tax is generally due each year on the interest earned; it is exempt from state and local income taxes1. Retirement-account tax rules differ14.
Can a bond ladder lose money? Yes. A rung sold early can fetch less than you paid, and an issuer that fails to repay can cost principal. A Treasury held to maturity repays face value2.
Sources & Disclosure
1 Treasury Notes. TreasuryDirect; issuance terms, fixed interest rate, semiannual payments and income-tax treatment. Checked November 11, 2026. 2 Treasury Notes, kids' basics page. TreasuryDirect; face value paid at maturity and purchase price versus face value. 3 Selected Interest Rates (Daily), H.15. Federal Reserve Board, November 9, 2026 release; November 6, 2026 Treasury constant-maturity observations. The hypothetical uses 4.33%, 4.51%, 4.59% and 4.64%; the four-year 4.62% input is a disclosed rounded interpolation. 4 Understanding Pricing and Interest Rates. TreasuryDirect; coupon payments on face value, par pricing when coupon equals yield, and the separate treatment of discount bills. 5 Investor Bulletin: Fixed Income Investments, When Interest Rates Go Up, Prices of Fixed-Rate Bonds Fall. SEC, Investor.gov, June 26, 2013; interest-rate risk and the $1,000, 3% semiannual-coupon examples with nine years remaining. 6 Treasury Bills. TreasuryDirect; terms through 52 weeks and interest paid at maturity as the difference between purchase price and face value. Checked November 11, 2026. 7 FAQs About Treasury Marketable Securities. TreasuryDirect; secondary-market purchases and sales. Checked November 11, 2026. 8 Secondary Market. Investor.gov, SEC; definition of a market where existing securities are bought and sold. 9 Selling a Treasury Marketable Security. TreasuryDirect, Department of the Treasury; bank/broker/dealer sale route and the 45-day TreasuryDirect holding restriction. Checked November 11, 2026. 10 Callable Bonds: Be Aware That Your Issuer May Come Calling. Financial Industry Regulatory Authority (FINRA), April 19, 2024; issuer call rights and refinancing when rates fall. 11 Callable or Redeemable Bonds. Investor.gov, SEC; corporate and municipal call provisions and reinvestment risk following a call. Current page checked November 11, 2026. 12 Bonds, FAQs. Investor.gov, SEC; credit risk, interest-rate risk and inflation reducing purchasing power. 13 Treasury Inflation-Protected Securities (TIPS). TreasuryDirect; inflation-adjusted principal and 5-, 10- and 30-year original terms. Checked November 11, 2026. 14 Publication 590-B (2025), Distributions from Individual Retirement Arrangements (IRAs), introduction. Internal Revenue Service; retirement-account earnings generally taxed on distribution, with exceptions under the applicable rules.
Wealthion is a dba of Greylock Peak Investments, a registered investment adviser. This article is general information only. It is not investment advice or an offer or solicitation, and it is not tailored to your circumstances. Guests’ views are their own and may not reflect those of Wealthion. Wealthion has not verified guest statements, including any performance figures. Investing involves risk, including loss of principal, and past performance does not guarantee future results. Wealthion refers readers to other registered investment advisers and shares in the fees they receive from referred clients, which creates a conflict of interest. Please see our Form ADV Part 2A and consult your own financial advisor before investing.
What Serious Investors Are Watching
Dive into expert interviews, market analysis, and long-form content built to help serious investors think long-term.

Bond Ladders Explained: How Staggered Maturities Work
A bond ladder spreads one sum across bonds that mature in different years, so cash...

Social Security COLA Explained: How the Annual Increase Is Calculated
The 2027 Social Security raise is 3.6%, produced by one price index and a rounding...
Interval Funds Explained: How Withdrawals Work When the Assets Are Hard to Sell
Interval funds buy back your shares only at set times and in set amounts. That...
Enjoyed This? Get More Insights
Expert insights and curated opportunities, delivered to your inbox.
Ready to Position for What's Coming?
Whether you're still learning or ready to act, your next step starts here.
- Independent
- Macro-Informed
- Real Asset Focused


The Wealthion Network
By subscribing, you agree to receive Wealthion emails. Unsubscribe anytime.
The Wealthion Network
By subscribing, you agree to receive Wealthion emails. Unsubscribe anytime.
Network Discussion
Join the Wealthion Network to Comment