

Growth vs Value Investing: Which Works Better, and When?
Growth looks for expanding businesses. Value looks for lower prices relative to earnings or assets. Each has had years in the lead. Here's how the approaches differ, and what their records show.
Two companies earn the same profit per share. Yet one stock costs twice as much as the other. Is the first too expensive, or do investors expect its business to grow much faster?
Growth investors focus on how quickly a business could expand. Value investors focus on the price compared with what the company earns or owns. Both depend on how the business performs after the shares are bought 1.
Suppose two companies each earn $5 per share, but investors expect one to grow faster 2.
| Faster growth expected | Slower growth expected | |
|---|---|---|
| Share price | $150 | $75 |
| Annual earnings per share | $5.00 | $5.00 |
| Price divided by earnings | 30 times | 15 times |
Hypothetical comparison. These are assumed prices and earnings, not observed investments. Wealthion calculations 2.
The first stock costs twice as much for each dollar of current profit. If its earnings rise to $6 and its share price stays at $150, the multiple falls from 30 to 25. If earnings stay at $5 and the price stays at $150, it remains 30 2.
The lower-priced stock has its own risk. If earnings fall from $5 to $2.50 while its price stays at $75, its multiple rises from 15 to 30. The price hasn't changed, but the apparent bargain has. These are changes in valuation ratios, not investment returns 2.
How does each style pick stocks?
Growth looks at how fast a company is expanding. Value looks at how much you pay for what it already has.
MSCI, a major index provider, sorts large and mid-sized United States (US) companies using measures like these. For value, it uses a company's book value (assets in its accounts minus what it owes), its expected earnings and its dividends, each compared with the share price. For growth, it uses past and expected growth in earnings per share, along with past growth in sales per share 1.
MSCI splits the broader index into growth and value, each targeting about half its market value. A company can sit partly in both. The two styles are parts of that same index 1.
How the two compared on October 30, 2026:
| Growth | Value | |
|---|---|---|
| Price compared with expected earnings | 23.5 times | 15.7 times |
| Price compared with book value | 12.3 times | 3.7 times |
| Dividend yield | 0.38% | 1.82% |
MSCI USA Growth and MSCI USA Value indexes, October 30, 2026. Expected earnings refer to the next 12 months; dividend yield compares annual dividends with the share price 3, 4.
Have recent years favored growth?
Yes, by a wide margin, until very recently.
MSCI's US growth index beat its value index in 8 of the 11 years from 2015 to 2025. The gaps were often large: in 2023, growth returned 46.7% and value 9.2% 3, 4. Over the 10 years to October 30, 2026, growth returned 18.7% a year, value 11.5% and the broader MSCI USA index 15.4% 3, 4.
Growth led in 8 of the 11 years from 2015 to 2025
Calendar-year gross returns in US dollars, before fees. MSCI USA Growth and MSCI USA Value indexes, 2015–2025; factsheets dated October 30, 2026. Letters identify each year's leader: G for growth, V for value 3, 4.
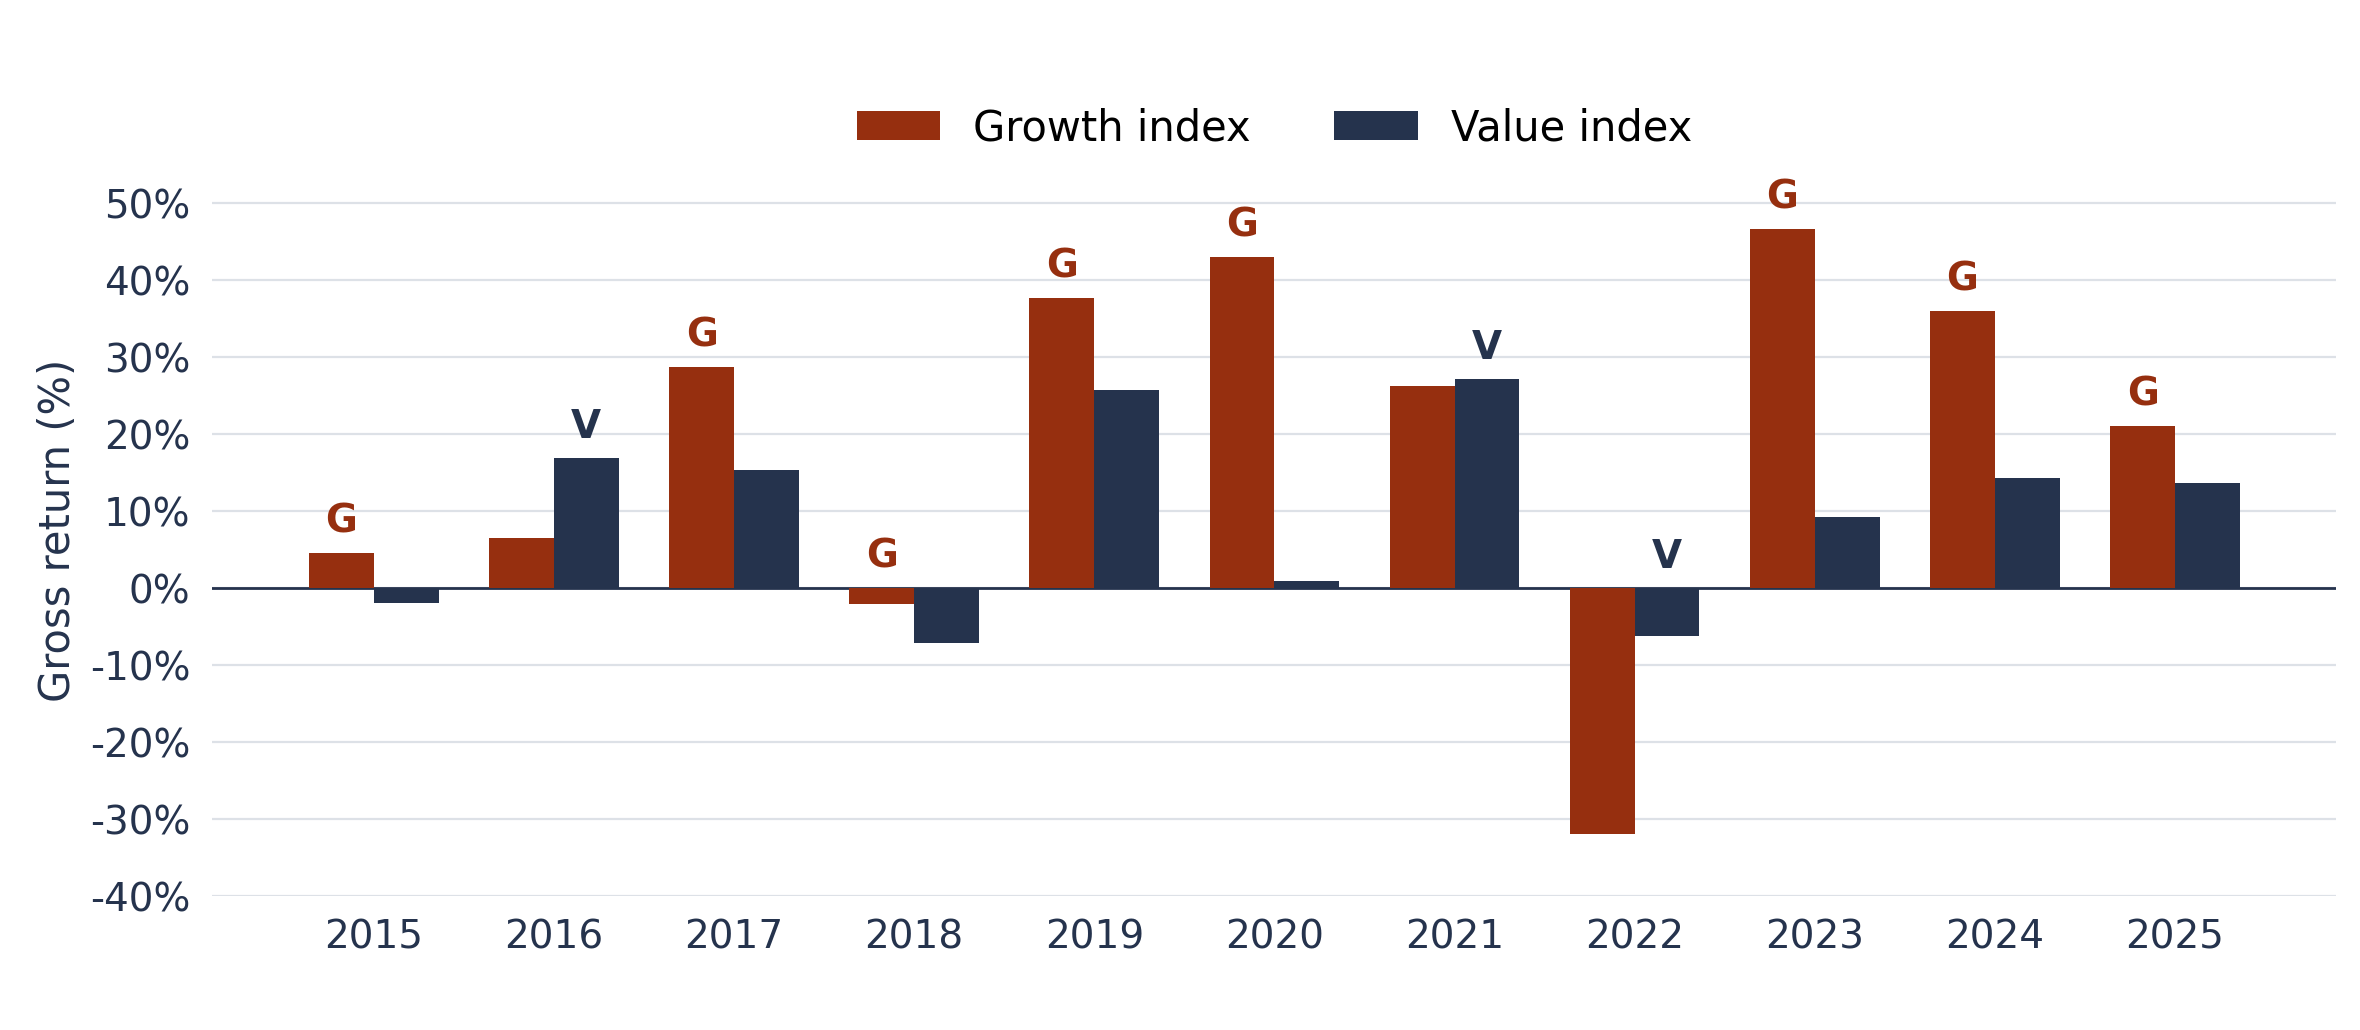
The growth index is also heavily concentrated in a handful of very large technology companies. Its two largest holdings alone made up about 31% in October 2026, its 10 largest holdings 64.5% and technology companies 52.3% 3. The styles have also suffered different losses: in 2022, growth lost 32.0% while value lost 6.2% 3, 4.
Then the lead swung. Over the 12 months to October 30, 2026, value returned 22.2% and growth just 2.0% 3, 4. These are gross index returns before fees; fund returns can differ.
Does history favor value?
In the cited research, yes before 2007. MSCI's longer index history shows a smaller gap.
The modern case for value was popularized by a 1992 study by economists Eugene Fama and Kenneth French, which found that stocks priced low relative to book value had earned higher average returns 5. Researchers later estimated that value beat growth by about 6% a year from July 1963 to June 2007 6.
Then came a long losing stretch. From January 2007 through June 2020, value investors' wealth fell about 55% relative to growth investors' wealth in one analysis. That is a relative shortfall, not a 55% absolute loss. The authors largely attributed it to growth becoming more expensive relative to value 6.
For large US value stocks, the average advantage over the market fell from about 4.3% a year in July 1963–June 1991 to 0.6% in July 1991–June 2019. These yearly figures are monthly averages multiplied by 12. Returns were too noisy to tell from those averages whether the expected advantage had truly shrunk 7.
The longer pattern is easier to see in a rolling ten-year chart. Each point below shows the annualized result over the previous decade for a research strategy that buys value stocks and bets against growth stocks. Here, value and growth mean stocks priced low or high relative to book value. These research portfolios differ from the MSCI indexes above 8.
Ten-year results for the value-minus-growth strategy
Rolling ten-year, annualized HML (High Minus Low) long-short research returns, June 1936–January 2021. Wealthion recreation from the Kenneth French Data Library, September 2026 data vintage; before trading costs. Past performance does not guarantee future results 8.
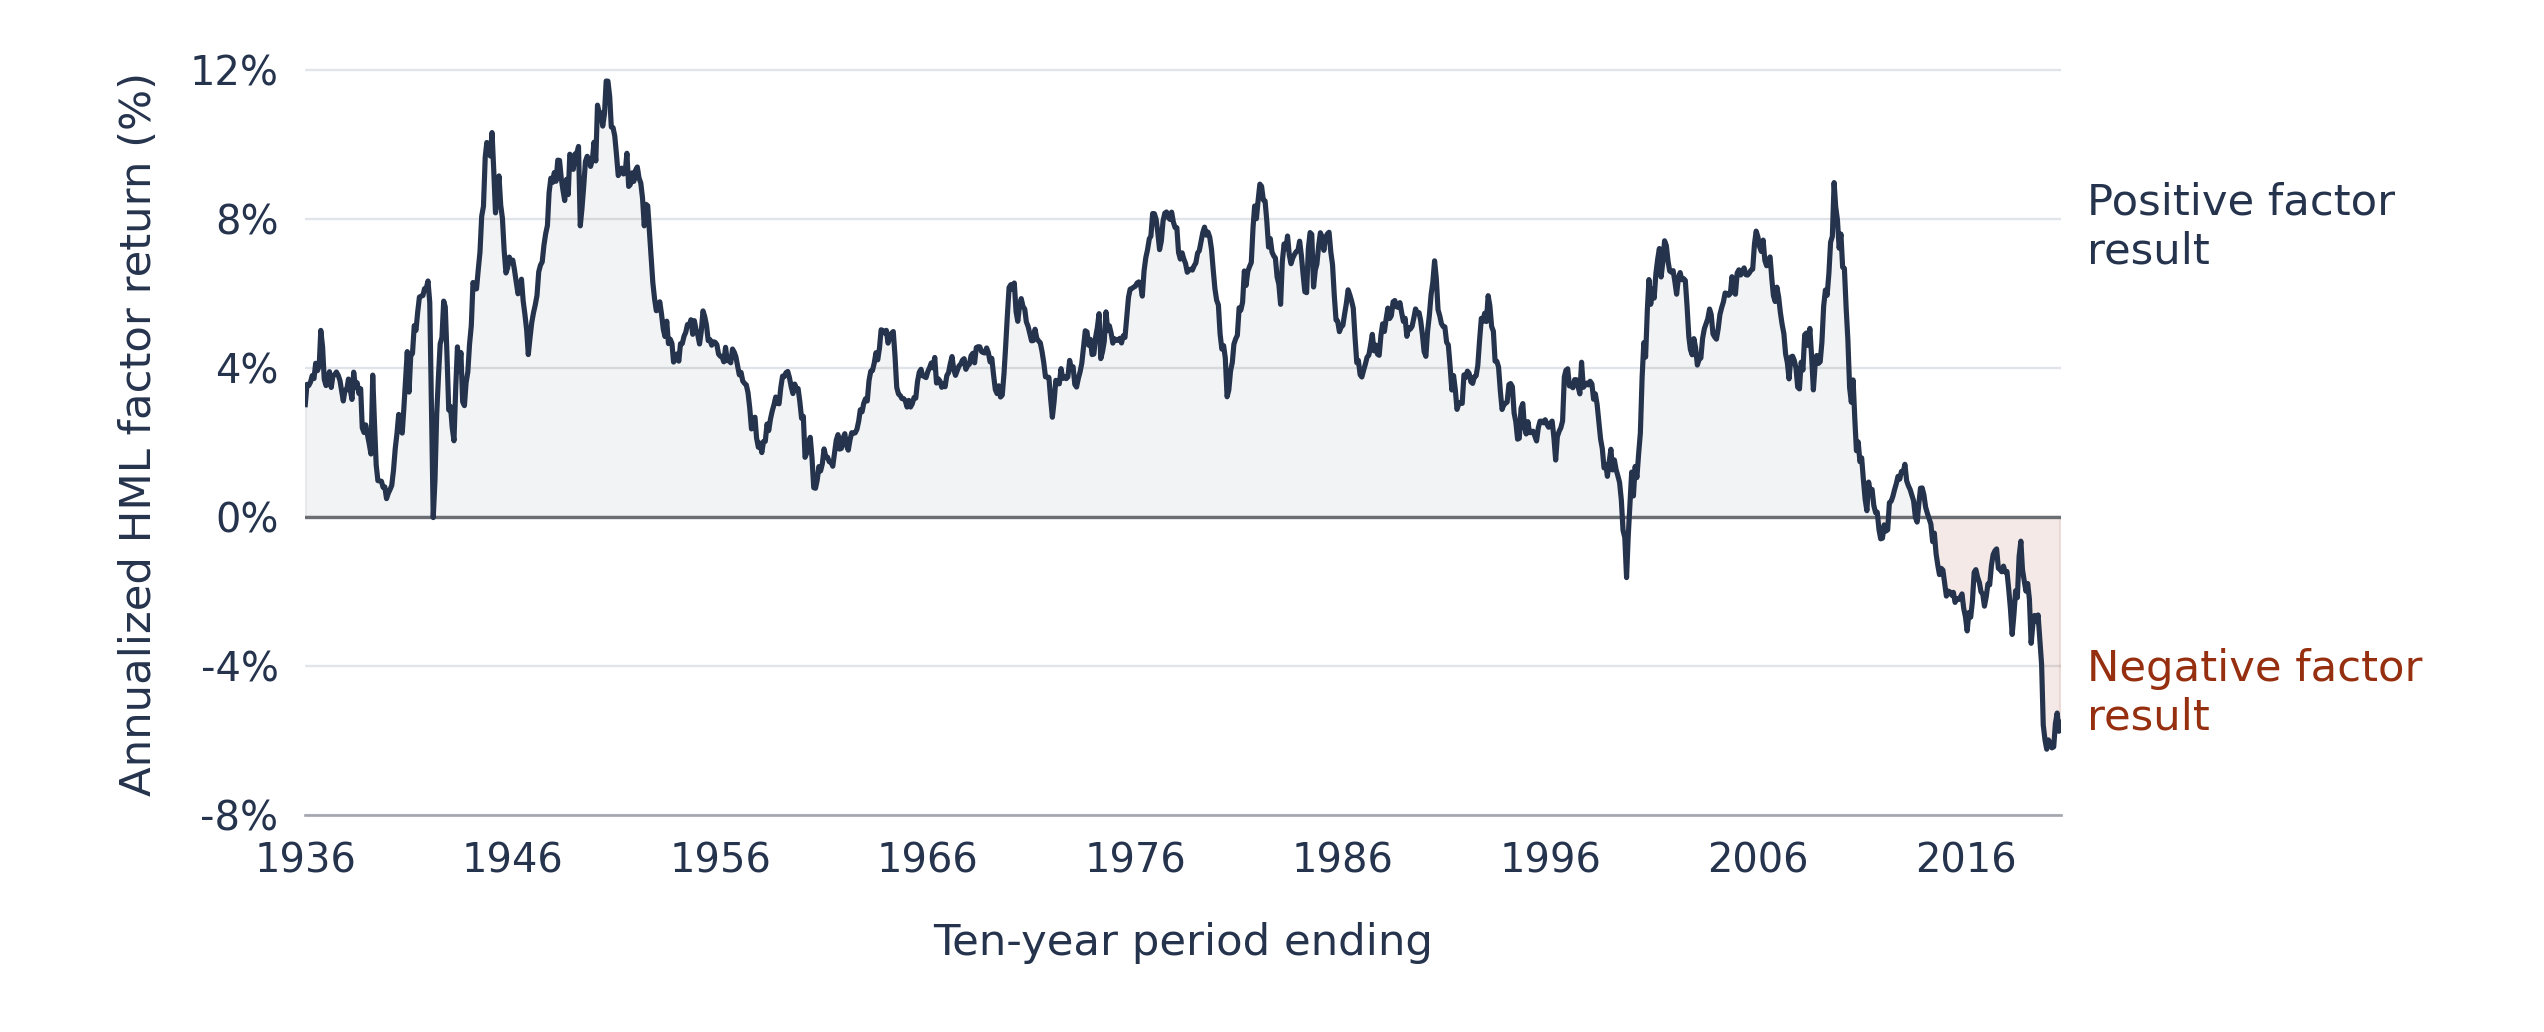
The line spent much of this history above zero, then stayed below it for years. Even a decade could produce a losing result for the strategy. This chart stops in January 2021; it shows a past stretch of weak results, not today's market 8.
MSCI's own longer history points to a smaller gap: since the end of 1974, its growth index returned 12.5% a year and its value index 11.9% through October 30, 2026 3, 4. These indexes differ from the research portfolios. Small yearly gaps compound over decades. And everything before the indexes' December 1997 launch is back-tested.
Where do they stand now?
Growth carried a higher price relative to expected earnings.
In October 2026, MSCI's growth index traded at 23.5 times expected earnings, against 15.7 times for value and 18.7 times for the broader MSCI USA index 3, 4. Investors were paying more for each dollar of the growth companies' expected profit.
The gap doesn't tell you what happens next. Growth can stay expensive for years if earnings keep rising. And value stocks can stay low-priced for good reasons. Both depend on expectations: the earnings investors expect, the price they pay and whether the business delivers.
Why might investors hold both?
The matching style indexes are two parts of the same broader index.
The two MSCI indexes together contain the same stocks as the broader index. When combined in proportion to their market values, they also match its stock weights 1. Over the past decade, the record favored growth. Over the past year, it favored value.
The gaps have run both ways. In 2022, growth lost 32.0% and value 6.2%. In 2020, growth gained 43.1% while value gained 1.0% 3, 4. A mix held through either year without rebalancing would have returned something between those paired results, before costs.
How can investors think about choosing?
A few points help frame the choice.
Concentration differs. A growth fund can put a large share of its money in a few technology companies, as the MSCI index illustrates. The style label alone doesn't describe that concentration 3.
Income and taxes differ. The value index had a higher dividend yield in this comparison 3, 4. In a US taxable account, dividends are generally taxable income. Qualified dividends receive federal capital-gains rates rather than ordinary income-tax rates when the requirements are met 9.
Each can disappoint for a different reason. A growth company's earnings may fall short of expectations. A value company's low price may reflect lasting business problems. Neither label guarantees a recovery.
Broad stock funds already hold both. A broad stock-index fund includes growth and value companies. Adding an overlapping style fund changes the weights; it doesn't necessarily add new companies 1.
Growth emphasizes expansion. Value emphasizes price relative to the business. Each has had long spells in the lead. As the opening example shows, the earnings matter, and so does the price paid.
Frequently asked questions
Is growth or value investing better? Neither has won across all the periods examined. Growth led for most of 2015–2025 in MSCI's US indexes. Value led in the cited research before 2007 and over the year ending October 30, 2026 3, 4, 6.
Do growth and value funds overlap? They can. MSCI allows a company's weight to be split between matching growth and value indexes 1. The names alone don't establish how much two funds overlap.
We are not making any recommendations.
Sources & Disclosure
1 MSCI Global Investable Market Value and Growth Index Methodology. MSCI, May 2023, sections 1.2, 2.1 and 2.4–2.5; value and growth measures, approximately 50% market-value targets and partial allocation of a company to both styles. Matching style indexes partition their parent index; arbitrary pairs of funds may use different definitions. 2 Wealthion hypothetical price-to-earnings calculations. $150/$5 = 30; $75/$5 = 15; $150/$6 = 25; $75/$2.50 = 30. Each changed-earnings case holds its share price constant. Valuation ratios only, not investment returns or forecasts; no dividends, taxes or trading costs modeled. 3 MSCI USA Growth Index (USD), gross-return factsheet, October 30, 2026, pp. 1–2. Calendar-year returns, 2015–2025; one-year return 2.02%; annualized 10-year return 18.69% and since December 31, 1974 return 12.48%; forward price/earnings 23.53; price/book value 12.26; dividend yield 0.38%; top two weights 16.09% and 14.95%, top 10 total 64.51%, information technology 52.28%. MSCI USA comparison: 10-year 15.41%, forward price/earnings 18.70. Accessed November 15, 2026. 4 MSCI USA Value Index (USD), gross-return factsheet, October 30, 2026, pp. 1–2. Calendar-year returns, 2015–2025; one-year return 22.21%; annualized 10-year return 11.46% and since December 31, 1974 return 11.86%; forward price/earnings 15.69; price/book value 3.70; dividend yield 1.82%. Both style indexes launched December 8, 1997; earlier results are back-tested. Accessed November 15, 2026. 5 The Cross-Section of Expected Stock Returns. Fama and French, Journal of Finance 47(2), June 1992, pp. 427–465; higher book-to-market equity associated with higher average historical stock returns. 6 Reports of Value's Death May Be Greatly Exaggerated. Arnott, Harvey, Kalesnik and Linnainmaa, Financial Analysts Journal 77(1), 2021, pp. 44–67. Table 3: approximately 6% annual value/growth advantage, July 1963–June 2007, under log-return attribution. January 2007–June 2020: approximately 55% relative-wealth shortfall, not an absolute long-only loss; authors' revaluation attribution. The research portfolios differ from MSCI style indexes. 7 The Value Premium. Fama and French, Review of Asset Pricing Studies 11(1), 2021, pp. 105–121; original January 2020 manuscript, Table 1 and pp. 4–5. Large value stocks minus the market: average monthly premiums 0.36% in July 1963–June 1991 and 0.05% in July 1991–June 2019. Multiplying by 12 gives 4.32% and 0.60%, not compounded annual investment returns. Uncertainty in differences between sample averages is distinct from the paper's conditional-regression findings. 8 Kenneth R. French Data Library, Fama/French 3 Factors, monthly HML (High Minus Low), July 1926–September 2026, created using the 202609 CRSP database. Original ZIP downloaded and verified November 13, 2026. HML is the average return on small and large high-book-to-market value portfolios minus the average on small and large low-book-to-market growth portfolios. Wealthion chart calculation: compound 120 monthly HML observations for each endpoint, then annualize using a one-tenth power, less one. Historical window June 1936–January 2021 follows Figure 1 of Vanguard’s April 2021 Value versus growth stocks report; this recreation uses the September 2026 data vintage, so revisions can differ from the original 2021 line. These are long-short factor calculations before trading costs, not the difference between long-only fund returns or an investable fund track record. 9 Topic No. 404, Dividends and Other Corporate Distributions. Internal Revenue Service; ordinary and qualified dividends and federal capital-gains tax treatment. Accessed November 15, 2026.
Wealthion is a dba of Greylock Peak Investments, a registered investment adviser. This article is general information only. It is not investment advice or an offer or solicitation, and it is not tailored to your circumstances. Guests’ views are their own and may not reflect those of Wealthion. Wealthion has not verified guest statements, including any performance figures. Investing involves risk, including loss of principal, and past performance does not guarantee future results. Wealthion refers readers to other registered investment advisers and shares in the fees they receive from referred clients, which creates a conflict of interest. Please see our Form ADV Part 2A and consult your own financial advisor before investing.
What Serious Investors Are Watching
Dive into expert interviews, market analysis, and long-form content built to help serious investors think long-term.

Data-Center Construction Companies: Backlogs, Margins and Execution Risk
The contractors that build data centers report in a language of their own: backlog, margin,...

Growth vs Value Investing: Which Works Better, and When?
Growth looks for expanding businesses. Value looks for lower prices relative to earnings or assets....

Momentum vs Value Investing: How the Approaches Differ
Value looks for bargains. Momentum follows recent winners. Each has had its turn in the...
Enjoyed This? Get More Insights
Expert insights and curated opportunities, delivered to your inbox.
Ready to Position for What's Coming?
Whether you're still learning or ready to act, your next step starts here.
- Independent
- Macro-Informed
- Real Asset Focused


The Wealthion Network
By subscribing, you agree to receive Wealthion emails. Unsubscribe anytime.
The Wealthion Network
By subscribing, you agree to receive Wealthion emails. Unsubscribe anytime.
Network Discussion
Join the Wealthion Network to Comment