

Momentum vs Value Investing: How the Approaches Differ
Value looks for bargains. Momentum follows recent winners. Each has had its turn in the lead. Here's how they compare, where they can go wrong, and why researchers study them together.
A stock has had a great year. One investor sees that strength as a reason to pay attention. Another looks at the same price and wonders whether the business can justify it.
That difference gets to the heart of momentum and value investing. Momentum starts with how a stock has been performing. Value starts with what its price buys in relation to the business behind it. They're different ways of sorting stocks, with different reasons for owning them and different ways things can go wrong.
Value starts with the business
A $20 stock isn't automatically cheaper than a $100 stock. The share price needs something to compare it with. Value investors look at earnings or book value, the assets in the company's accounts minus what it owes. They're looking for a low price relative to the business 1, 2.
Take a company whose shares cost $100 and whose annual earnings are $5 per share. Its price is 20 times those earnings. If the share price falls to $50 and earnings stay at $5, the multiple falls to 10. Each share now costs half as much for the same amount of annual earnings 3.
| Illustrative share price | Annual earnings per share | Price divided by earnings |
|---|---|---|
| $100 | $5.00 | 20 times |
| $50 | $5.00 | 10 times |
| $50 | $2.50 | 20 times |
Illustration only. Share price divided by annual earnings per share; no future return is projected. Wealthion calculations 3.
But suppose earnings also halve, to $2.50 per share. The stock is back at 20 times earnings. The lower price hasn't made it cheaper on that measure.
This is where the bargain-hunting description needs care. A business can look inexpensive because expectations are too gloomy. It can also look inexpensive because its prospects have deteriorated. A low multiple starts that discussion; it doesn't settle it 2.
Momentum starts with the price trend
Momentum looks at a different piece of information: which stocks have performed better than others over a recent period. The idea is that those winners may keep leading for a while. It isn't asking whether the company is cheap 4, 5.
One common measure compares returns from 12 months ago to one month ago, leaving out the latest month. Stocks are then ranked against each other. In a falling market, the winners may simply be the stocks that lost less than their peers 5.
Now return to the company whose share price halved while earnings stayed steady. It's cheaper on earnings. Yet if its return also trails other stocks, it looks weaker on momentum. The same price drop can make it look cheaper to one approach and weaker to the other. They're asking different questions.
Have recent years favored momentum?
For a while. Then the lead swung back.
MSCI, a major index provider, publishes momentum and enhanced value indexes for large and mid-sized United States (US) companies. Its momentum index beat its value index every year from 2017 to 2020, and again in 2024, when it returned 32.3% against 7.4% for value. Value led from 2021 to 2023 and in 2025, when it returned 32.9% against 17.8% 6, 7.
The lead between momentum and value has kept swinging
Calendar-year gross returns in US dollars, before fees. MSCI USA Momentum and MSCI USA Enhanced Value indexes, 2015–2025; factsheets dated October 30, 2026 6, 7.
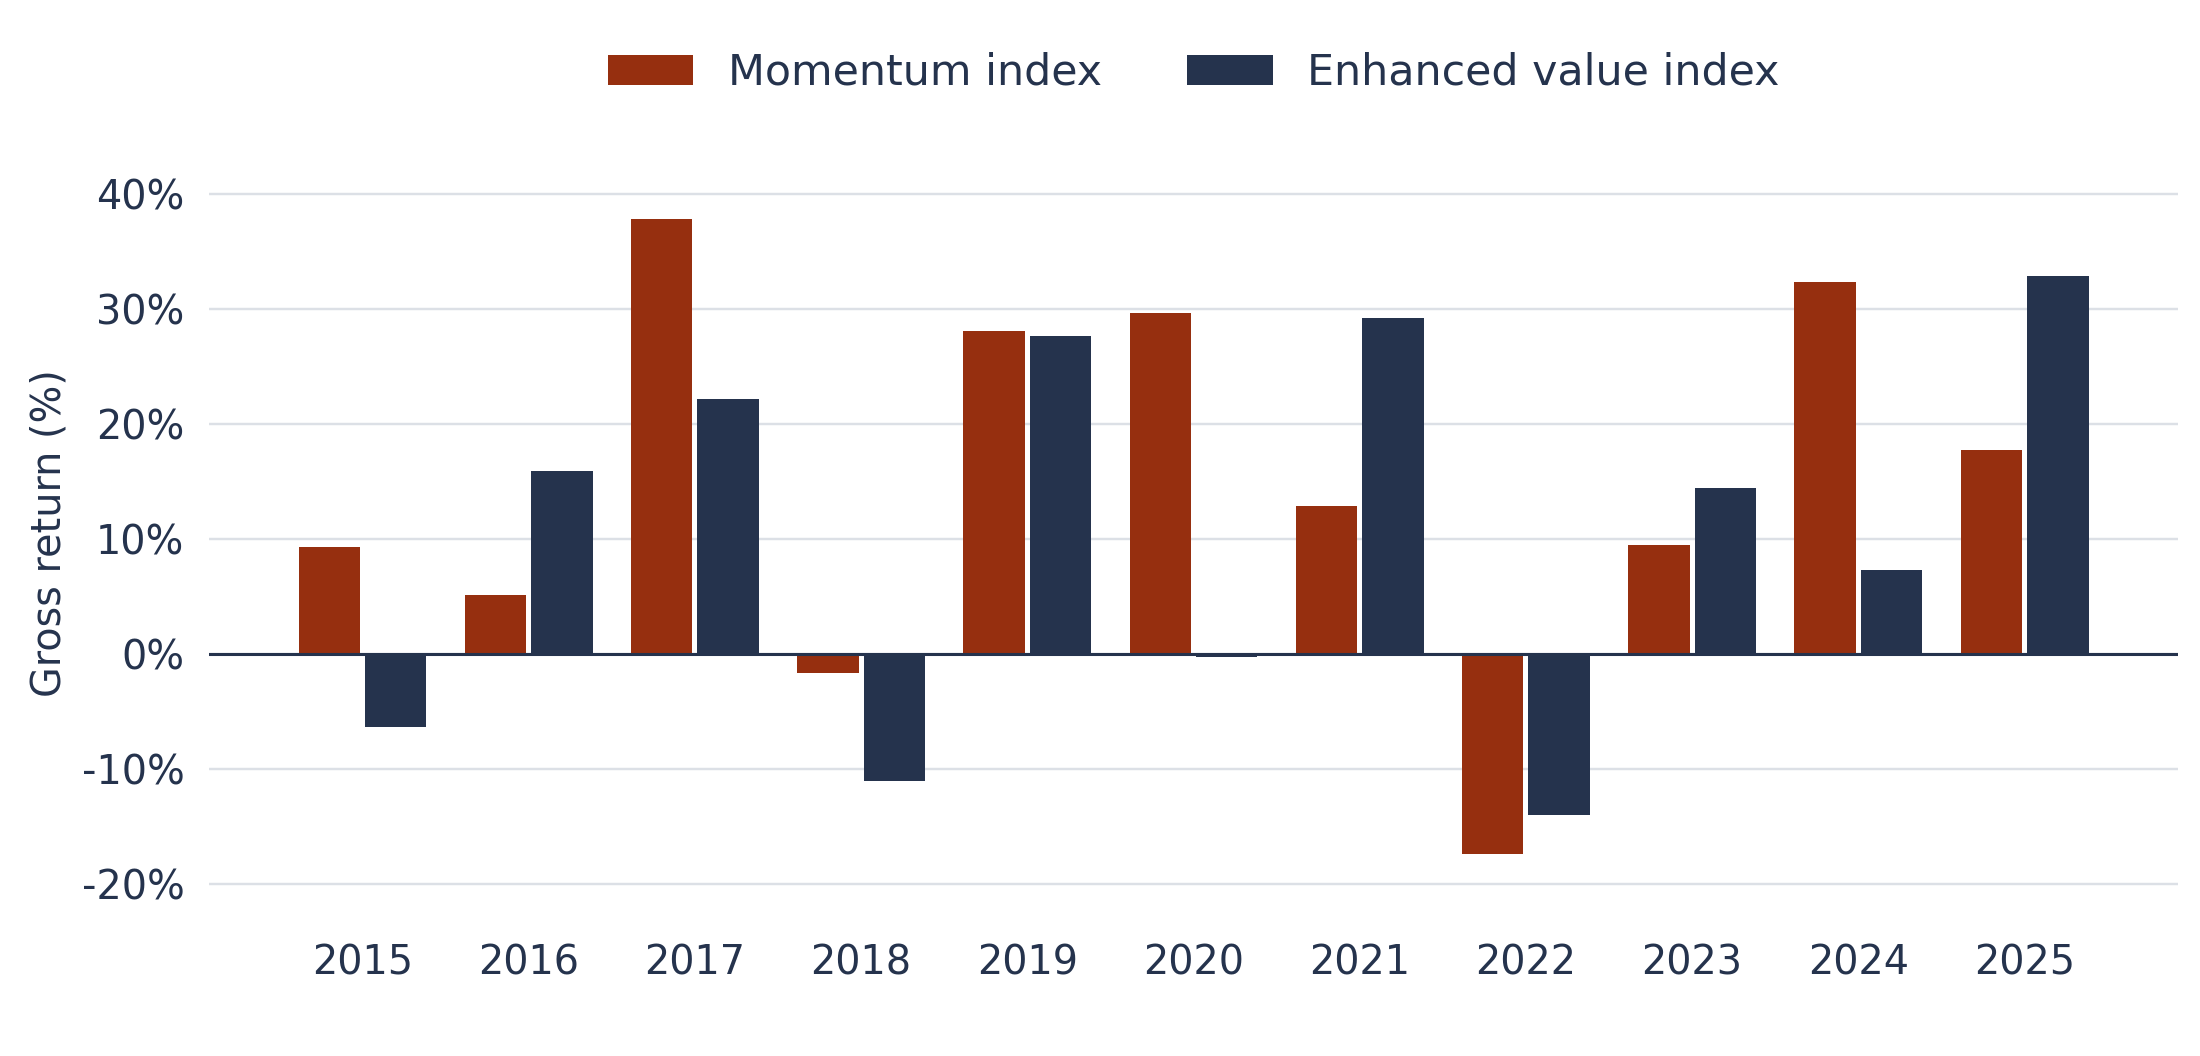
Over the 12 months to October 30, 2026, value returned 52.6% against 12.4% for momentum. Over the past 10 years, the two almost tied: annualized returns of 14.8% for value and 15.2% for momentum. Neither beat the broader MSCI USA index, at 15.4% 6, 7. These are gross index returns, before fees; fund returns can differ.
Does history favor value?
The research supports both.
The modern case for value draws on a 1992 study by Eugene Fama and Kenneth French, which found that stocks cheap relative to book value had earned higher average returns 8. Researchers later estimated that value beat growth by about 6% a year from July 1963 to June 2007 9. In 1993, Narasimhan Jegadeesh and Sheridan Titman showed that buying recent winners and selling recent losers short paid off over the following three to 12 months 10. Short selling means selling borrowed shares 11. A 2013 study by Asness, Moskowitz and Pedersen found both patterns across eight markets and asset groups 4.
Value also endured a long losing stretch against growth. From January 2007 through June 2020, value investors' wealth fell about 55% relative to growth investors' wealth in one analysis. That is a relative shortfall, not a 55% absolute loss 9.
Another Fama and French study compared large US value stocks with the market. Their average advantage fell from about 4.3% a year in 1963–1991 to 0.6% in 1991–2019. The yearly figures are the monthly averages multiplied by 12. Returns varied too much to tell from those averages whether the expected advantage had truly shrunk 12.
Why can momentum and value work better together?
Because the same falling stock can look cheaper to one and weaker to the other.
Picture a company whose shares have dropped all year while its book value hasn't changed. To a value investor, it's now cheaper on that measure. To a momentum investor, it's weaker if it has also trailed other stocks. The two can reach opposite verdicts on the same company.
The research shows that contrast. In US stocks from January 1972 to July 2011, the study's value and momentum returns had a -0.53 correlation after adjusting for broad market moves. They tended to move in opposite directions 4.
A 50/50 mix also improved the study's global result. It earned roughly twice as much return above cash for each unit of volatility, or return swings, as either style alone, before trading costs. These research portfolios covered several asset groups and balanced volatility across markets; they weren't ordinary US stock funds 4.
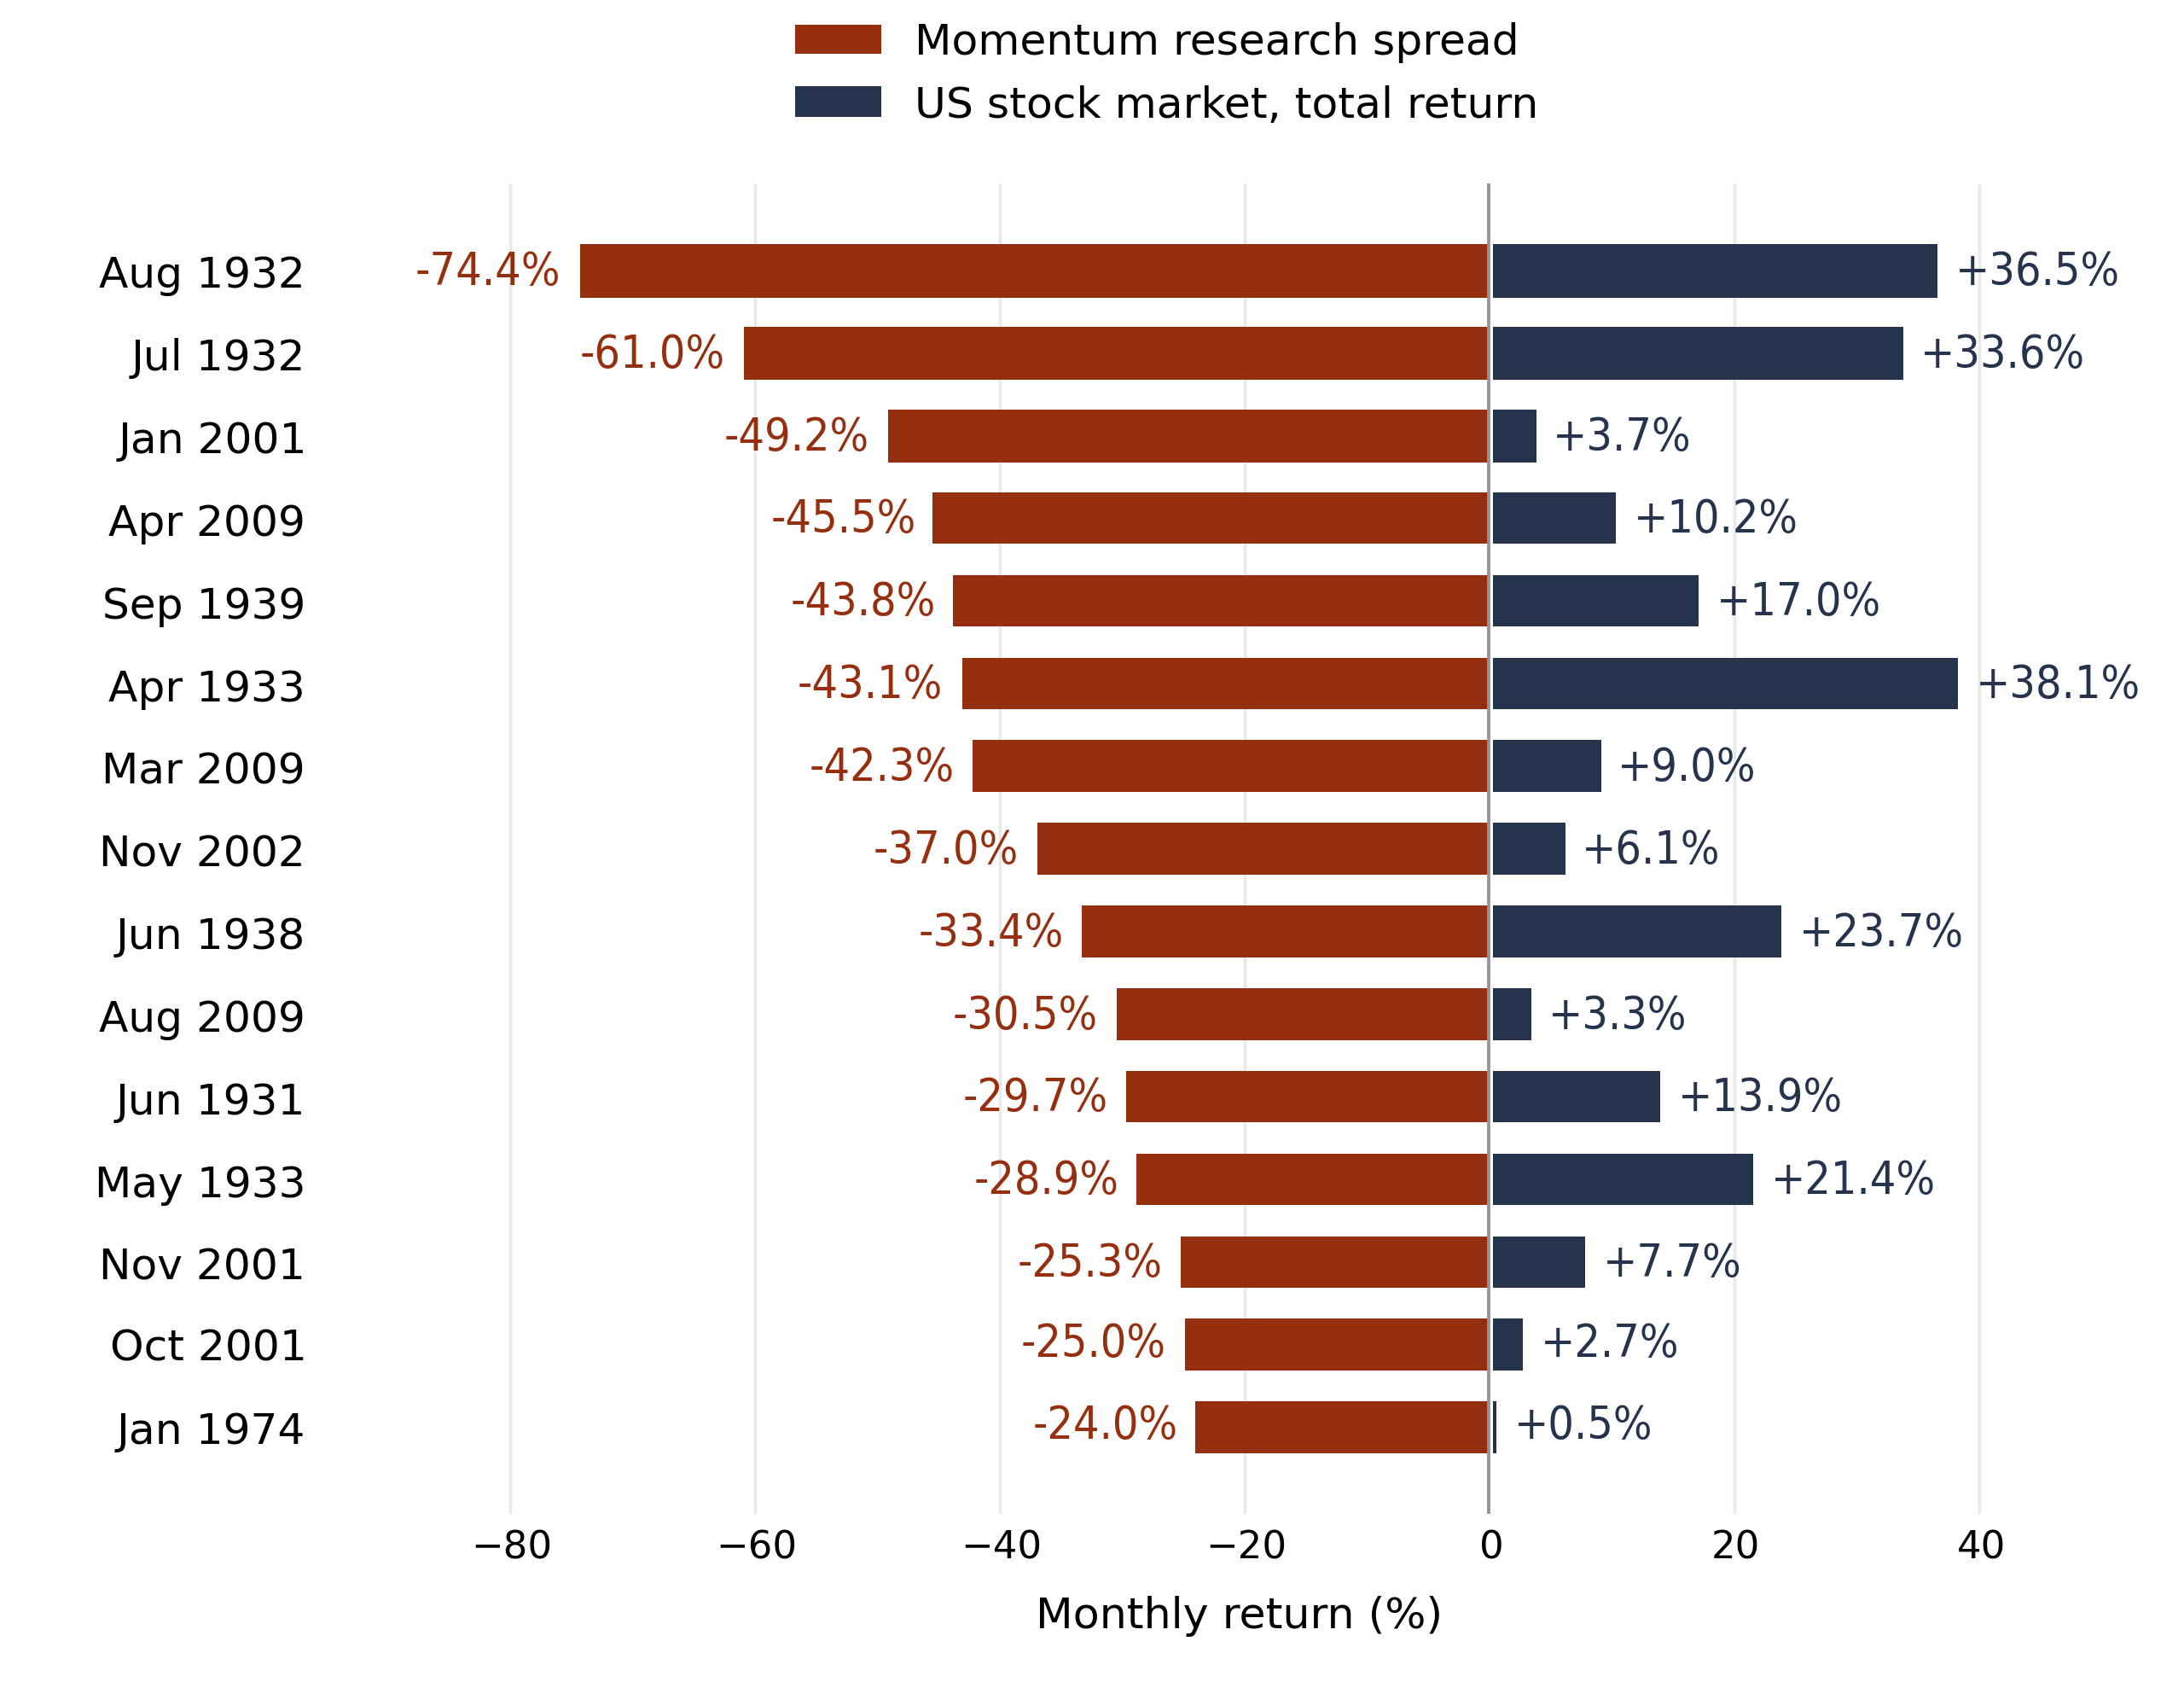
Their bad periods can take different shapes. Value's weakness against growth lasted years. Momentum has suffered severe losses when beaten-down stocks rebounded, sometimes across several months. From March through May 2009, a past-loser stock portfolio rose 163%, while past winners gained 8%. Short positions in those rebounding losers caused large losses 13.
In each of momentum's 15 worst months in the study, the stock market rose
US monthly returns, January 1927 to March 2013. Momentum: top-tenth past winners minus bottom-tenth past losers. Market: value-weighted US stock-market total return. Daniel and Moskowitz, Table 2 13.
How can investors think about combining them?
The comparison involves more than choosing a mix.
The result depends on both styles. Combining them makes the return less dependent on one approach alone. It doesn't make either one win more often, and both can lose together, as the 2022 MSCI index returns show 6, 7.
Trading costs matter. In one US study, monthly turnover was about a third for momentum and 3% for value, averaging trading on the long and short sides. Modeled trading costs cut momentum's average return roughly in half 14. Those are research results, not a cost estimate for every fund.
Taxes matter too. In US taxable accounts, net gains on investments held a year or less generally face ordinary federal income-tax rates. Most net long-term gains face base rates of 0%, 15% or 20%; exceptions and additional taxes can apply. Losses can offset gains 15.
The holdings can overlap. Two style labels don't necessarily mean two different sets of companies. A stock can be cheap relative to earnings and still have strong recent returns 3, 5.
Research results can weaken. A study of 97 published return predictors found average returns 58% lower after publication than in the original samples 16. That is an aggregate finding, not a forecast for either style.
Value looks for a low price relative to the business. Momentum follows recent winners. Each has had its years in the lead. Combining them brings both approaches into the result, along with their costs and risks.
Frequently asked questions
Is momentum or value investing better? Neither led throughout the recent MSCI record. Each led for several years, and over the 10 years to October 30, 2026, their annualized index returns were close 6, 7.
What is a momentum crash? A deep loss in a momentum strategy, often when beaten-down stocks rebound after a market fall. Losses can cluster across months 13.
We are not making any recommendations.
Sources & Disclosure
1 Description of Fama/French Factors and six size/book-to-market portfolios. Kenneth R. French Data Library, Dartmouth; book equity relative to market equity as a value measure. Accessed November 13, 2026. 2 Contrarian Investment, Extrapolation, and Risk. Lakonishok, Shleifer and Vishny, Journal of Finance 49(5), December 1994, pp. 1541-1578. 3 Wealthion hypothetical price-to-earnings calculations: $100 divided by $5 = 20; $50 divided by $5 = 10; $50 divided by $2.50 = 20. Valuation ratios only; no future return is projected. 4 Value and Momentum Everywhere. Asness, Moskowitz and Pedersen, Journal of Finance 68(3), 2013, pp. 929–985. Table I: market-adjusted US spread correlation -0.53, January 1972–July 2011; global all-asset Sharpe ratios 0.73 for value, 0.67 for momentum and 1.42 for an equal style mix, before costs, with volatility balanced across markets. Research portfolios own one group and short another. 5 Description of Momentum Factor. Kenneth R. French Data Library, Dartmouth; relative prior 2–12-month returns. Accessed November 14, 2026. 6 MSCI USA Momentum Index (USD), gross-return factsheet, October 30, 2026, p. 1. Calendar-year returns, 2015–2025, 12-month gross return of 12.41%, and annualized 10-year gross return of 15.19%, versus 15.41% for MSCI USA. Accessed November 15, 2026. 7 MSCI USA Enhanced Value Index (USD), gross-return factsheet, October 30, 2026, p. 1. Calendar-year returns, 2015–2025, 12-month gross return of 52.58%, and annualized 10-year gross return of 14.79%, versus 15.41% for MSCI USA. Accessed November 15, 2026. 8 The Cross-Section of Expected Stock Returns. Fama and French, Journal of Finance 47(2), June 1992, pp. 427-465. 9 Reports of Value's Death May Be Greatly Exaggerated. Arnott, Harvey, Kalesnik and Linnainmaa, Financial Analysts Journal 77(1), 2021, pp. 44–67. Approximately 6% annual value/growth advantage, July 1963–June 2007, under the paper's log-return attribution; approximately 55% relative-wealth shortfall, January 2007–June 2020, not an absolute long-only loss. 10 Returns to Buying Winners and Selling Losers: Implications for Stock Market Efficiency. Jegadeesh and Titman, Journal of Finance 48(1), March 1993, pp. 65-91. 11 Stock Purchases and Sales: Long and Short. Investor.gov, US Securities and Exchange Commission; borrowed shares and losses when prices rise. Accessed November 14, 2026. 12 The Value Premium. Fama and French, Review of Asset Pricing Studies 11(1), 2021, pp. 105–121; original January 2020 manuscript, Table 1 and abstract. Large value stocks minus the market: monthly averages 0.36% in July 1963–June 1991 and 0.05% in July 1991–June 2019. Multiplying by 12 gives 4.32% and 0.60%; these are not compounded annual investment returns. 13 Momentum Crashes. Daniel and Moskowitz, Journal of Financial Economics 122(2), 2016, pp. 221–247; published author-hosted paper, sections 2.1–2.3 and Table 2, p. 227. The chart reproduces the 15 worst monthly winner-minus-loser decile spreads in January 1927–March 2013; market values are total returns, not excess returns. 14 A Taxonomy of Anomalies and Their Trading Costs. Novy-Marx and Velikov, Review of Financial Studies 29(1), 2016, pp. 104–147; author-hosted August 2015 manuscript, Tables 2–3. July 1963–December 2012 US value-weighted decile spreads and specified modeled trading costs. Monthly one-sided turnover averaged across long and short legs: 34.5% for momentum and 2.91% for value. Modeled costs reduce its average monthly momentum spread return from 1.33% to 0.68%; not net of all fees, financing costs or taxes. 15 Topic No. 409, Capital Gains and Losses. Internal Revenue Service; US federal holding-period, netting and capital-gains tax rules. Accessed November 14, 2026. 16 Does Academic Research Destroy Stock Return Predictability? McLean and Pontiff, Journal of Finance 71(1), February 2016, pp. 5-32.
Wealthion is a dba of Greylock Peak Investments, a registered investment adviser. This article is general information only. It is not investment advice or an offer or solicitation, and it is not tailored to your circumstances. Guests’ views are their own and may not reflect those of Wealthion. Wealthion has not verified guest statements, including any performance figures. Investing involves risk, including loss of principal, and past performance does not guarantee future results. Wealthion refers readers to other registered investment advisers and shares in the fees they receive from referred clients, which creates a conflict of interest. Please see our Form ADV Part 2A and consult your own financial advisor before investing.
What Serious Investors Are Watching
Dive into expert interviews, market analysis, and long-form content built to help serious investors think long-term.

Data-Center Construction Companies: Backlogs, Margins and Execution Risk
The contractors that build data centers report in a language of their own: backlog, margin,...

Growth vs Value Investing: Which Works Better, and When?
Growth looks for expanding businesses. Value looks for lower prices relative to earnings or assets....

Momentum vs Value Investing: How the Approaches Differ
Value looks for bargains. Momentum follows recent winners. Each has had its turn in the...
Enjoyed This? Get More Insights
Expert insights and curated opportunities, delivered to your inbox.
Ready to Position for What's Coming?
Whether you're still learning or ready to act, your next step starts here.
- Independent
- Macro-Informed
- Real Asset Focused


The Wealthion Network
By subscribing, you agree to receive Wealthion emails. Unsubscribe anytime.
The Wealthion Network
By subscribing, you agree to receive Wealthion emails. Unsubscribe anytime.
Network Discussion
Join the Wealthion Network to Comment