

Sequence-of-Returns Risk: How Early Losses Change Retirement Income
A market downturn doesn't put retirement expenses on hold. Money still has to leave the portfolio, and every withdrawal leaves less invested for a recovery.
That changes what an average return can tell us. Two portfolios can earn exactly the same returns over a decade, fund exactly the same withdrawals and finish far apart. The losses only have to arrive at different times.
That's sequence-of-returns risk: the risk that the order of investment returns affects the outcome when money is being added or withdrawn. For retirees, early losses can leave less capital supporting years of spending.1
The same returns can tell two different stories
Two hypothetical portfolios each begin with $1 million, with no contributions, withdrawals, fees or taxes.
Portfolio A earns these annual returns: −20%, −10%, +6%, +8%, +10%, +12%, +14%, +9%, +7% and +5%. Portfolio B earns the identical returns in reverse order, putting its losses last.
Both finish with about $1.42 million. Multiplying the same growth factors in a different order gives the same result. The annual returns average 4.1% when added and divided by 10. Compounding produces the same ending balance as a steady gain of about 3.6% a year. Neither average reveals the different paths they took.2
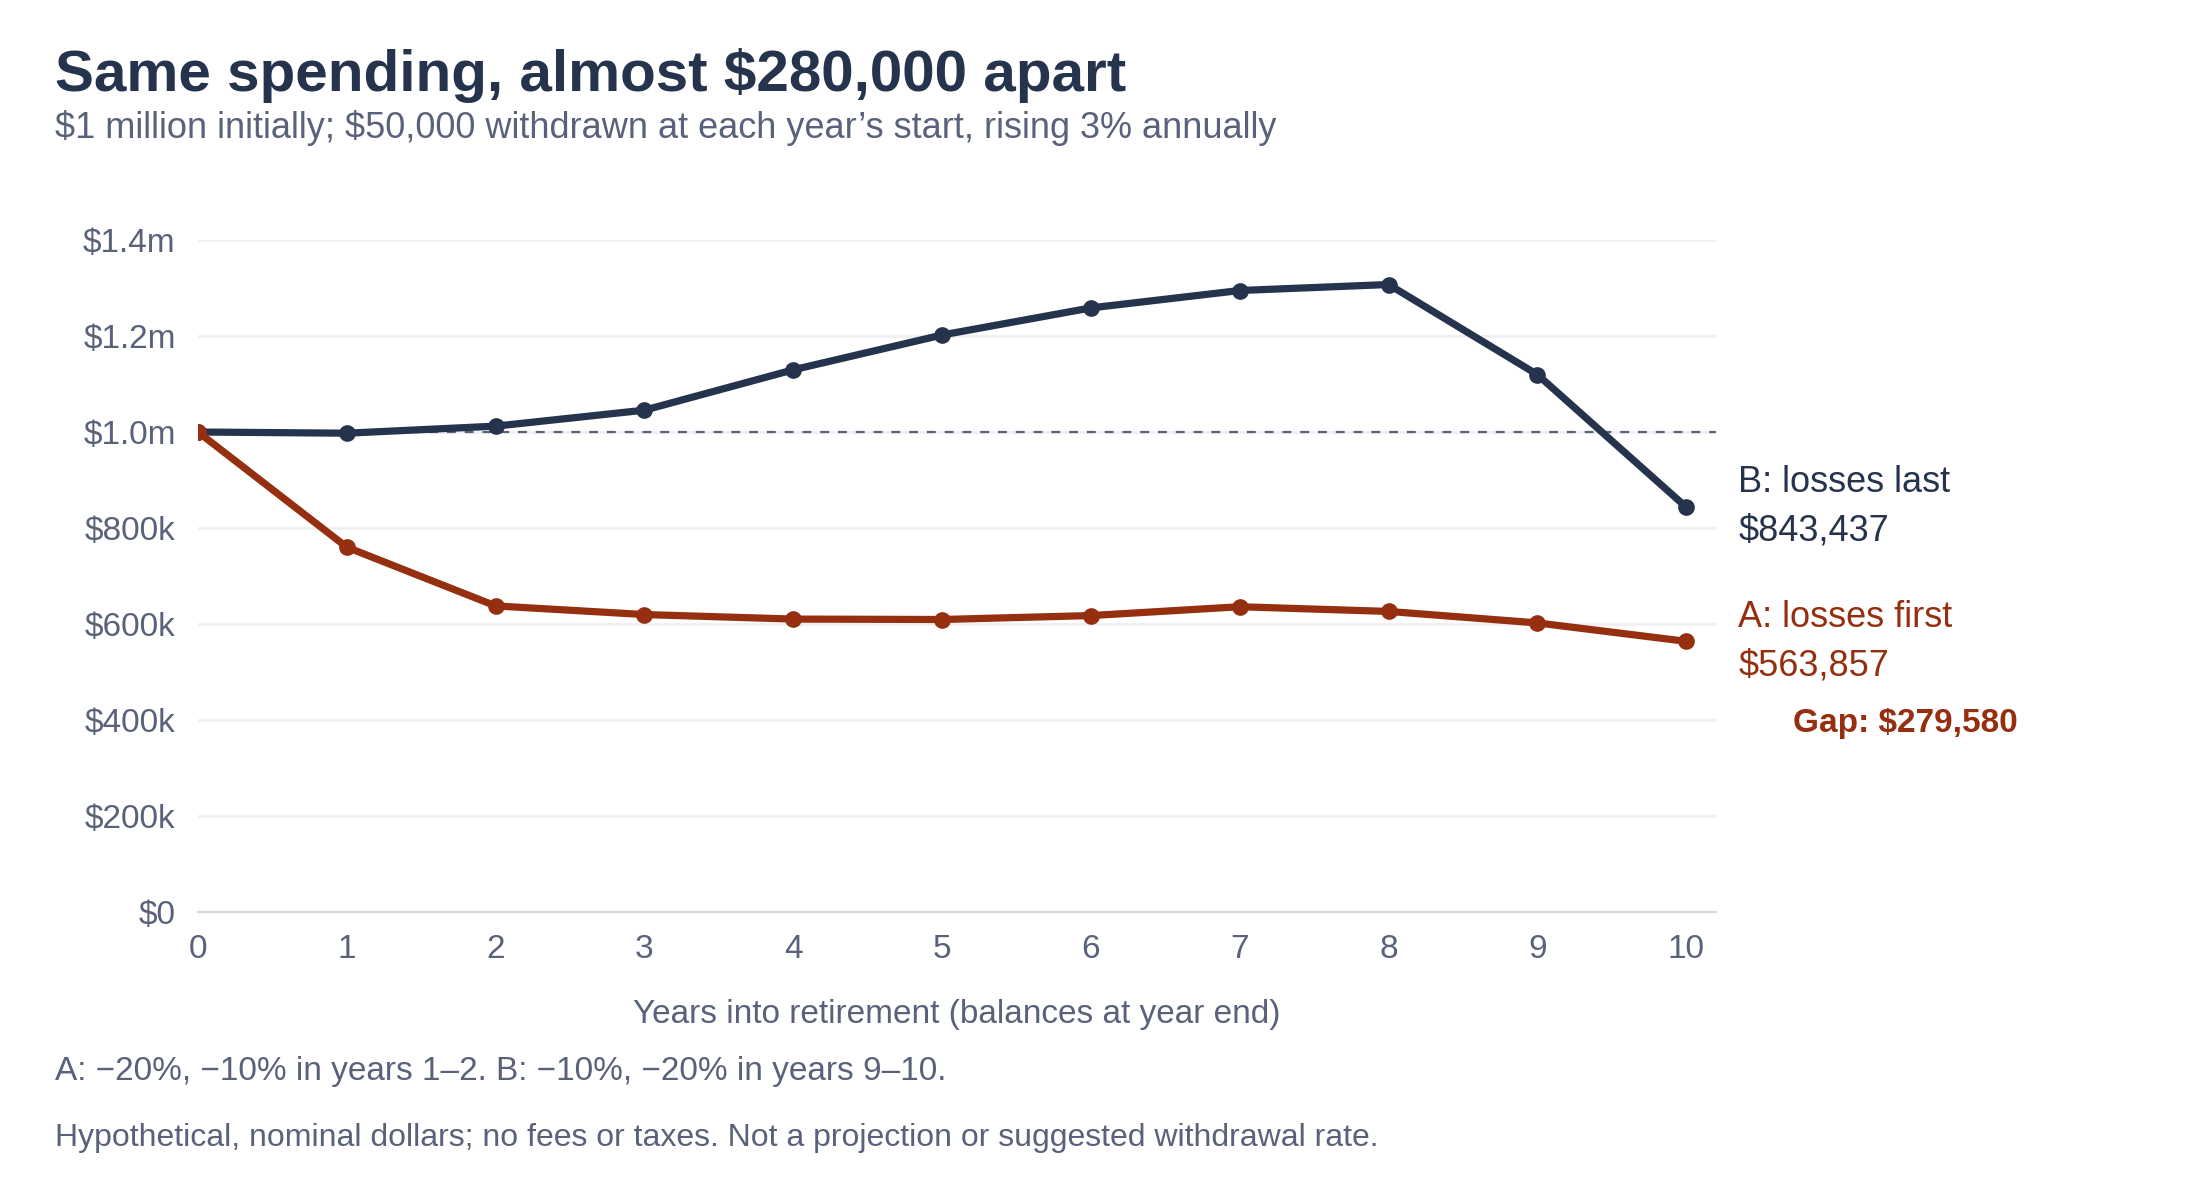
Now each portfolio pays out $50,000 at the start of the first year, with withdrawals rising 3% annually to match assumed inflation. Both pay out $573,194 over 10 years. The $50,000 starting amount illustrates the mechanism; it is not a suggested withdrawal rate. This hypothetical excludes fees and taxes and is not a projection.
Source: Wealthion hypothetical calculations.2
The finish line has changed. A ends with $563,857; B has $843,437. Reordering the same returns creates a $279,580 gap, even though both portfolios funded identical spending.2
A has eight consecutive positive years after its initial losses, yet never regains its starting balance. In its final three years, the investments gain while the account shrinks: withdrawals take out more than those gains put back.
A recovery reaches only the money still invested
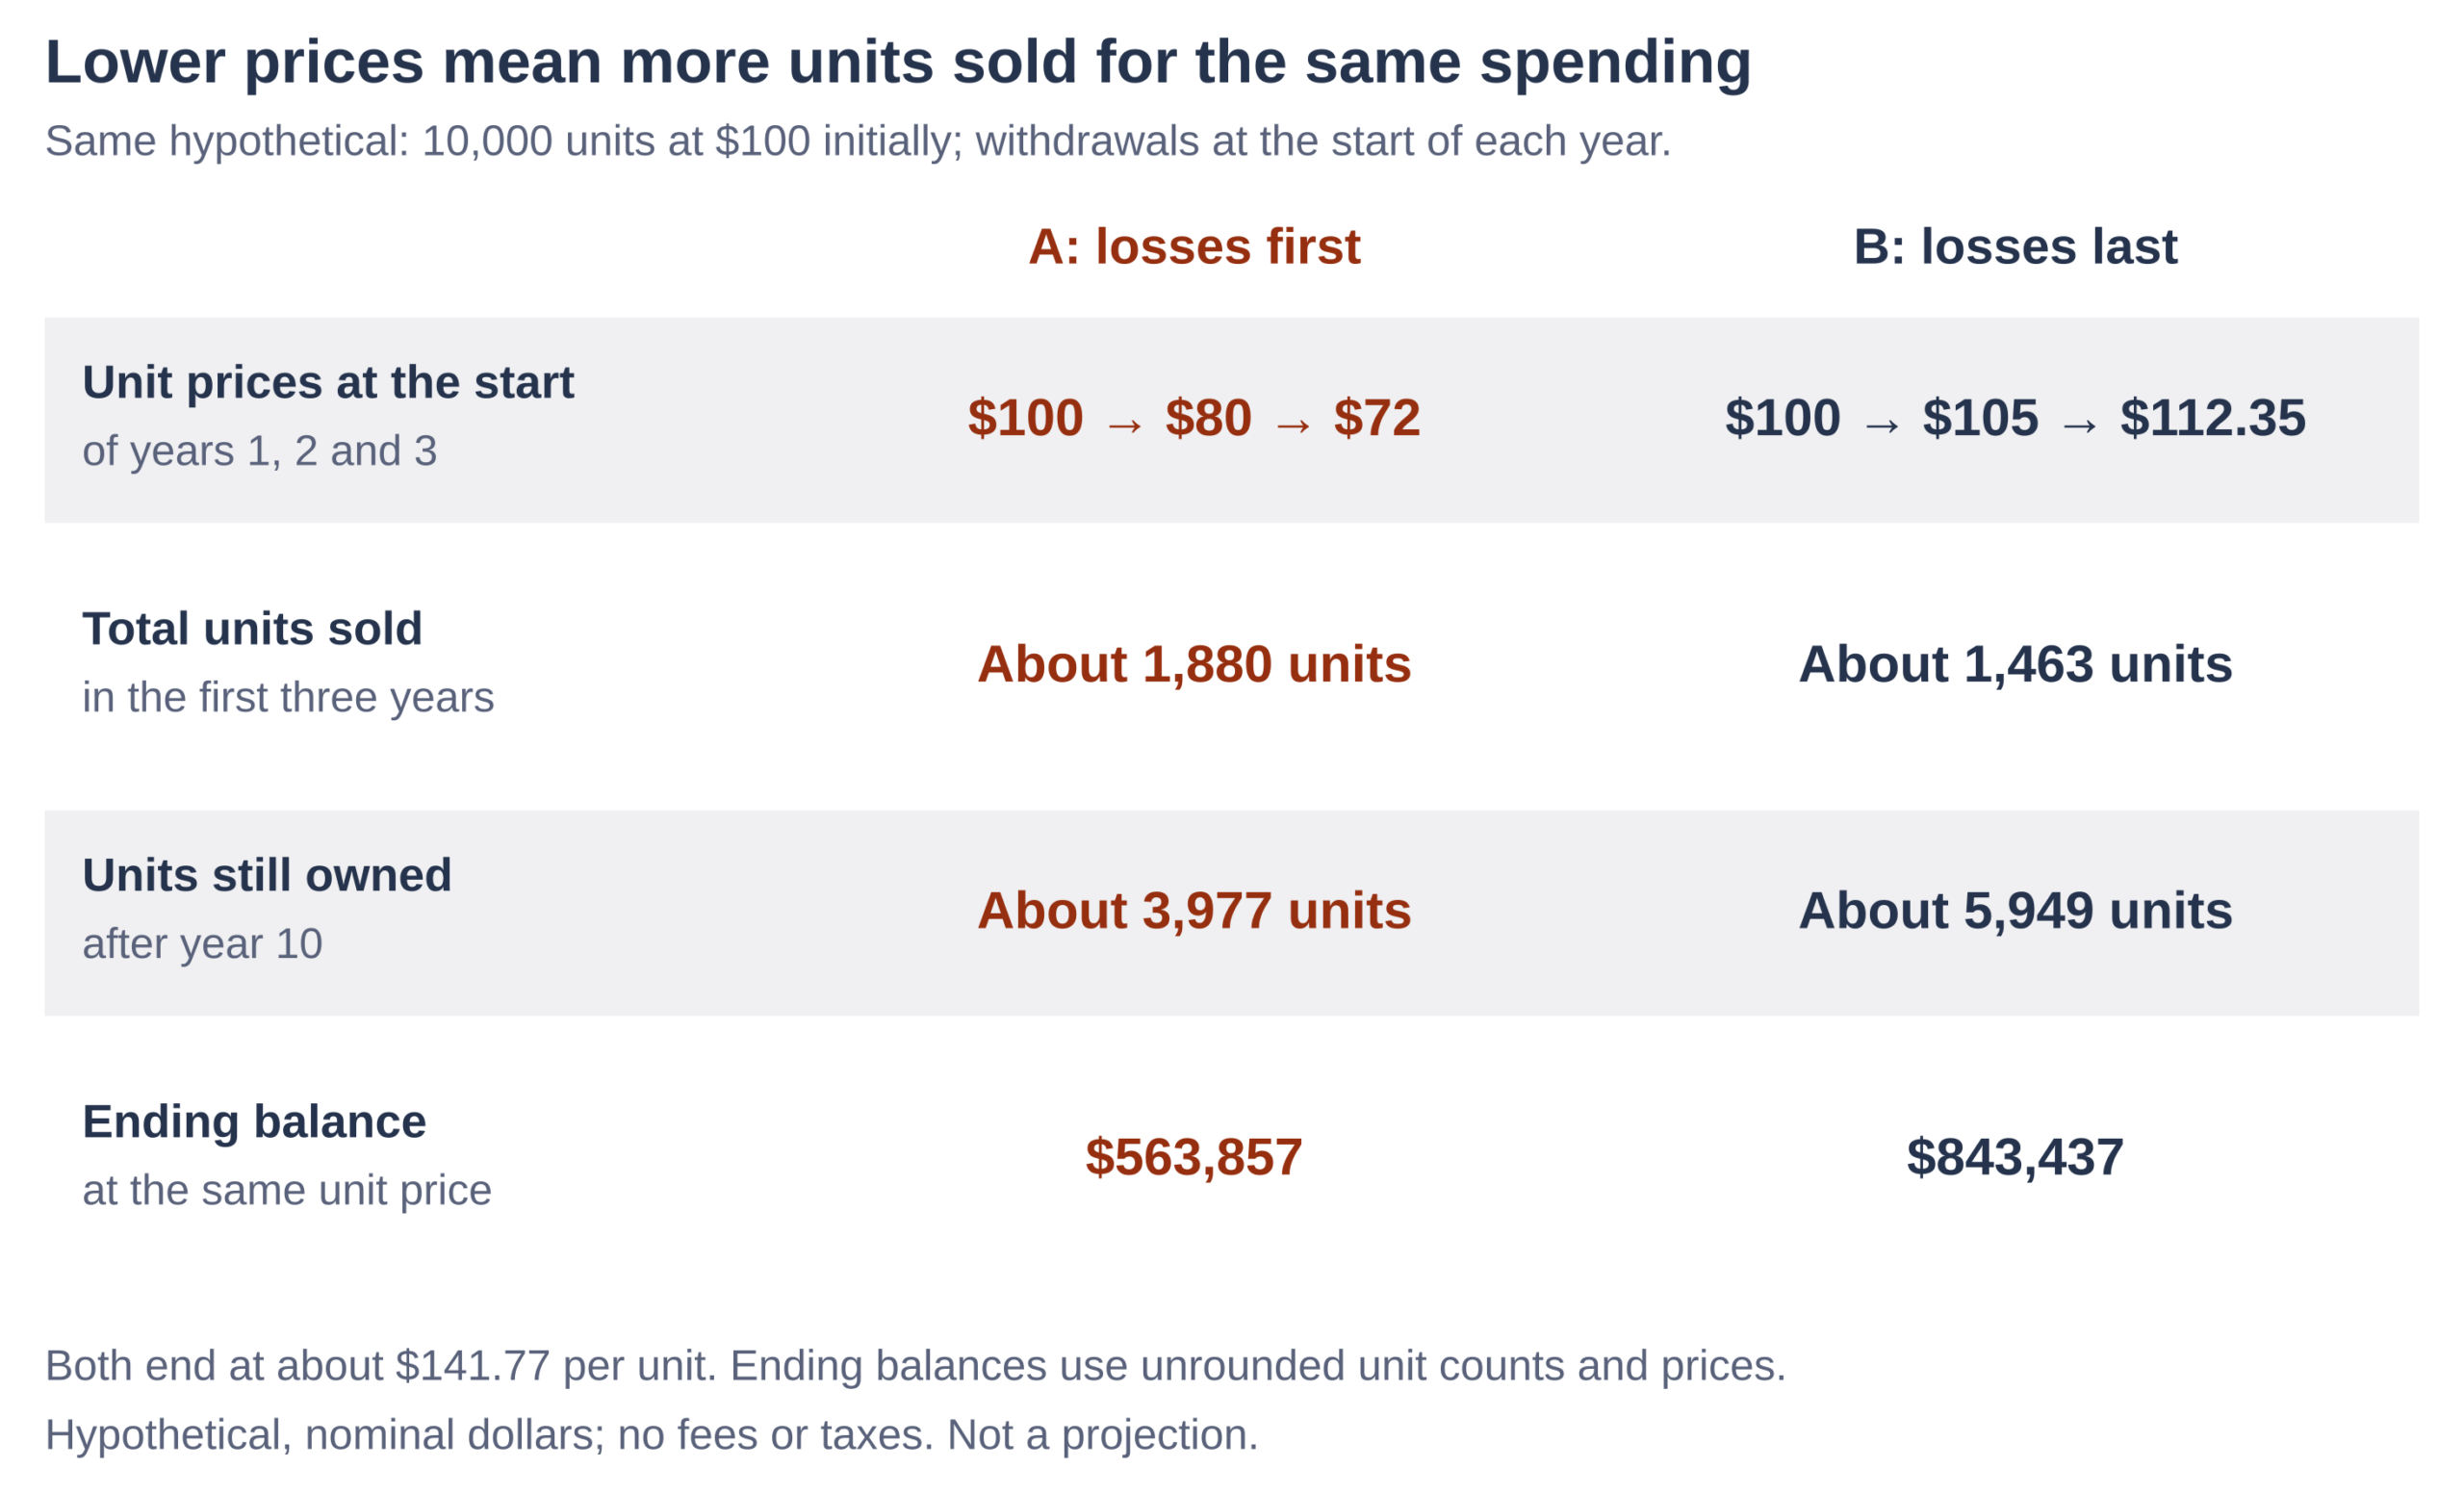
The difference becomes clearer when the portfolios are divided into units. Each starts with 10,000 units worth $100 apiece. A withdrawal sells enough units to raise the required dollars.
At the start of year three, both need to supply $53,045. A's unit price has fallen to $72, so it sells about 737 units. B's has risen to $112.35, so it sells about 472. A gives up more ownership to fund the same spending.2
Source: Wealthion hypothetical calculations; figures rounded from unrounded inputs.2
Both finish with the same unit price, about $141.77. A owns roughly 3,977 units; B owns 5,949. The recovery lifts the value of the units that remain. It cannot restore the units already sold.2
This is why early setbacks can have a long reach. They leave a smaller base to support the withdrawals still ahead. That doesn't mean the biggest dollar loss always comes early, or that a later decline is harmless. In this example, B enters its losing years with more money than it had at retirement.
Inflation and other income change the demand on the portfolio
Returns explain only part of the outcome. The other part is how much money has to come out, and how quickly that amount rises.
The following scenarios change one spending assumption at a time while keeping the same returns and start-of-year withdrawals. All figures are hypothetical, nominal and exclude fees and taxes.2
| Withdrawal assumption | A after 10 years | B after 10 years | Gap |
|---|---|---|---|
| First withdrawal $50,000; rises 3% annually | $563,857 | $843,437 | $279,580 |
| First withdrawal $50,000; rises 3.7% annually | $538,568 | $827,234 | $288,666 |
| First withdrawal $30,000; rises 3% annually | $905,385 | $1,073,133 | $167,748 |
| First withdrawal $50,000; skips inflation increase after a loss | $606,220 | $844,957 | $238,737 |
The 3.7% scenario uses the annual consumer-price increase reported for September 2026 by the United States Bureau of Labor Statistics. It is a sensitivity test, not an inflation forecast. Faster withdrawal increases widen the gap because more money leaves the portfolios each year.3
The outside-income scenario reduces the first portfolio withdrawal to $30,000, rising 3% annually. To maintain the original spending path, another source supplies $20,000 initially and also rises 3%. That assumption matters: a fixed pension would cover less of the spending bill as prices rose.
Social Security provides one example of income adjusted for inflation. Its announced 2027 cost-of-living adjustment is 3.6%, payable in January. The calculation compares third-quarter averages of the Consumer Price Index for Urban Wage Earners and Clerical Workers (CPI-W). It therefore follows earlier price changes and may differ from a household's own rising costs.4,5
Inflation also changes what the ending balances can buy. After 10 years at the assumed 3%, A's $563,857 is worth about $419,600 in starting-year dollars; B's $843,437 is worth about $627,600.2
Spending less preserves capital at a cost
The final scenario skips the annual inflation increase whenever the previous year's return was negative. Subsequent increases resume from that lower spending level; the missed increases are not made up.
That leaves A with $606,220 instead of $563,857. But A also withdraws $28,577 less over the decade. Total withdrawals fall to $544,617 for A and $571,294 for B, versus $573,194 each in the original example. The narrower gap no longer compares identical spending.2
Morningstar's 2025 retirement-income research found a related tradeoff: its tested flexible spending methods supported higher starting withdrawals than fixed inflation-adjusted spending, in exchange for potentially lower spending after weak markets. Those findings depend on its modeled returns, inflation, retirement horizon and success target. They do not establish an appropriate rate for every retiree.6
What the example can and cannot establish
These returns were chosen to make the mechanism visible. They show how timing changes an outcome, not how likely either outcome is. Ten years cannot establish whether a portfolio funds an entire retirement. Actual results also depend on investments, lifespan, taxes, fees and spending changes.
Historical research gives the mechanism a broader context. William Bengen's 1994 study tested inflation-adjusted withdrawals against United States stock and bond history beginning in 1926. Retirement starting dates produced different portfolio lifespans. He found the combination of falling markets and high inflation in 1973–74 especially damaging; trouble could reach portfolios whose withdrawals had begun many years earlier. His findings reflect historical assumptions, not a guarantee about future returns.7
Early losses matter because spending can remove capital before it has a chance to recover. How much that changes retirement income depends on the withdrawals still ahead, inflation, other income and the room to spend less. An average return leaves those relationships out.
Frequently asked questions
Does sequence risk matter before retirement?
It can when contributions are being made, because their timing changes how much money experiences each return. With no contributions or withdrawals, reversing the same portfolio returns leaves the ending value unchanged.2
Is there a universal safe withdrawal rate?
No. Morningstar's highest 2025 base-case estimate, 3.9%, came from modeled portfolios holding 30% to 50% stocks, with the rest in bonds and cash. It assumed a 30-year horizon, a 90% probability of money remaining, fixed inflation-adjusted spending and its own market forecasts. It excluded Social Security and other outside income. Those conditions define the estimate.6
We are not making any recommendations.
Sources & Disclosure
1 Institute of Business & Finance, Sequence-of-Returns Risk: Why Early Retirement Years Matter Most, sections on return timing and withdrawals; accessed November 12, 2026. 2 Wealthion calculations using the hypothetical returns and withdrawal rules stated in this article. Each year: ending balance = (starting balance − start-of-year withdrawal) × (1 + annual return). Unit quantities and dollar values are calculated without intermediate rounding; displayed values are rounded. These are illustrations, not market history or forecasts. 3 United States Bureau of Labor Statistics, Consumer Price Index, September 2026, released October 14, 2026; all-items Consumer Price Index for All Urban Consumers rose 3.7% over 12 months, not seasonally adjusted. 4 Social Security Administration, Social Security Announces 3.6 Percent Benefit Increase for 2027, October 14, 2026; higher Social Security payments begin January 2027. 5 Social Security Administration, Latest Cost-of-Living Adjustment, calculation and third-quarter comparison for the 2027 adjustment; accessed November 12, 2026. 6 Morningstar, The State of Retirement Income: 2025, December 3, 2025, pages 1 and 25–26; base-case assumptions and tradeoffs of flexible spending methods. 7 William P. Bengen, Determining Withdrawal Rates Using Historical Data, Journal of Financial Planning, October 1994, reprinted March 2004, pages 2–5 of the reprint; historical portfolio longevity, inflation and retirement starting dates.
Wealthion is a dba of Greylock Peak Investments, a registered investment adviser. This article is general information only. It is not investment advice or an offer or solicitation, and it is not tailored to your circumstances. Guests’ views are their own and may not reflect those of Wealthion. Wealthion has not verified guest statements, including any performance figures. Investing involves risk, including loss of principal, and past performance does not guarantee future results. Wealthion refers readers to other registered investment advisers and shares in the fees they receive from referred clients, which creates a conflict of interest. Please see our Form ADV Part 2A and consult your own financial advisor before investing.
What Serious Investors Are Watching
Dive into expert interviews, market analysis, and long-form content built to help serious investors think long-term.

Gold IRAs Explained: What the Rules Allow and What They Cost
An annual account fee is easy to spot. The extra amount built into a gold...

Uranium Spot vs Term Prices: Why the Headline Price Isn’t What Most Utilities Pay
Uranium headlines quoted $91.55 a pound at the end of October 2026. Reactor owners in...

REITs Explained: How Real Estate Investment Trusts Work
A REIT lets you own a share of real estate income without owning a building....
Enjoyed This? Get More Insights
Expert insights and curated opportunities, delivered to your inbox.
Ready to Position for What's Coming?
Whether you're still learning or ready to act, your next step starts here.
- Independent
- Macro-Informed
- Real Asset Focused


The Wealthion Network
By subscribing, you agree to receive Wealthion emails. Unsubscribe anytime.
The Wealthion Network
By subscribing, you agree to receive Wealthion emails. Unsubscribe anytime.
Network Discussion
Join the Wealthion Network to Comment