

Uranium Spot vs Term Prices: Why the Headline Price Isn’t What Most Utilities Pay
Uranium headlines quoted $91.55 a pound at the end of October 2026. Reactor owners in the United States (US) paid a weighted average of $58.46 per pound for uranium delivered in 2025. Both numbers are right. They measure different things, and the gap between them helps explain how this market works and what uranium miners actually earn.1,2
All prices are in US dollars per pound of uranium concentrate, triuranium octoxide (U₃O₈), unless stated otherwise. The Energy Information Administration (EIA) expresses other uranium forms on an equivalent basis; its uranium prices exclude conversion and enrichment services.2
The numbers at a glance
Why don't utilities pay the headline uranium price?
Think of the headline uranium price the way you'd think of the asking rent on a new lease today. Existing leases may carry rents agreed earlier. Some uranium contracts work similarly; others reset their price near delivery using a formula agreed years before.3
Start with the asking rents. On October 30, 2026, uranium for near-term delivery, the spot price, stood at $91.55 a pound. The long-term base-price indicator was $98.00, with future escalation depending on the contract. Both are averages of the month-end indicators from the market's two main price reporters, UxC and TradeTech, published by Cameco, the Canadian uranium producer. These are the figures that make the headlines.1,4
Now the rent people actually pay. In 2025, owners and operators of US nuclear plants paid a weighted average of $58.46 a pound for 46.9 million pounds of uranium delivered, according to EIA's Uranium Marketing Annual Report, released in July 2026.2 That was about $15 below the average of 2025's month-end spot prices, and about $23.50 below the average long-term indicator.1
Those gaps are approximate, because they compare a measured price for delivered uranium with an average of month-end quotes. The direction isn't in doubt, though. The gap reflects a mix of contract ages and pricing terms: long-term agreements can be signed years before delivery, without fixing every delivery's final price at signing.3
How is the uranium spot price different from term prices and what utilities pay?
Part of the confusion is that three different numbers all get called "the uranium price," and each one answers a different question.
Physical uranium trades are negotiated privately. Price reporters assess market conditions using bids, offers and transactions, so an indicator need not represent a completed deal at that exact price. The different numbers also cover different delivery and pricing horizons.1,5
| The number | What it measures | Who publishes it, and when |
|---|---|---|
| Spot price | Near-term price assessment. UxC's indicator considers delivery within three months; EIA's survey classifies spot contracts as usually delivered within a year.5,6 | Daily and weekly spot indicators; Cameco reproduces month-end figures1,5 |
| Long-term (term) price | An assessed base price for new long-term supply, with escalation to delivery. EIA separately classifies contracts with one or more deliveries beyond a year after signing as long-term.4,6 | Monthly indicators4 |
| Delivered average | Weighted average paid for reported uranium purchases delivered during a year, under old and new contracts | EIA, annually; 2025 data released in July 20262 |
The first two describe current market conditions for new near-term or long-term supply. The third records what US reactor owners actually paid for uranium. Its catch is that it arrives once a year, looking back.
Most US uranium moves under the second kind of deal. Long-term contracts supplied more than 70% of US owners' deliveries in every year from 2003 through 2025.7 Spot is the smaller channel: in 2025, spot contracts supplied 6.0 million of the 46.9 million pounds US owners received, roughly one pound in eight.7 Those spot pounds were also the expensive ones, at $75.83 on average against $55.91 for pounds under long-term contracts.6 The $75.83 figure covers all material forms on a uranium-concentrate-equivalent basis; Table 7's $76.01 applies to uranium concentrate alone.2
What US reactors pay tracks long-term contracts, not the spot market
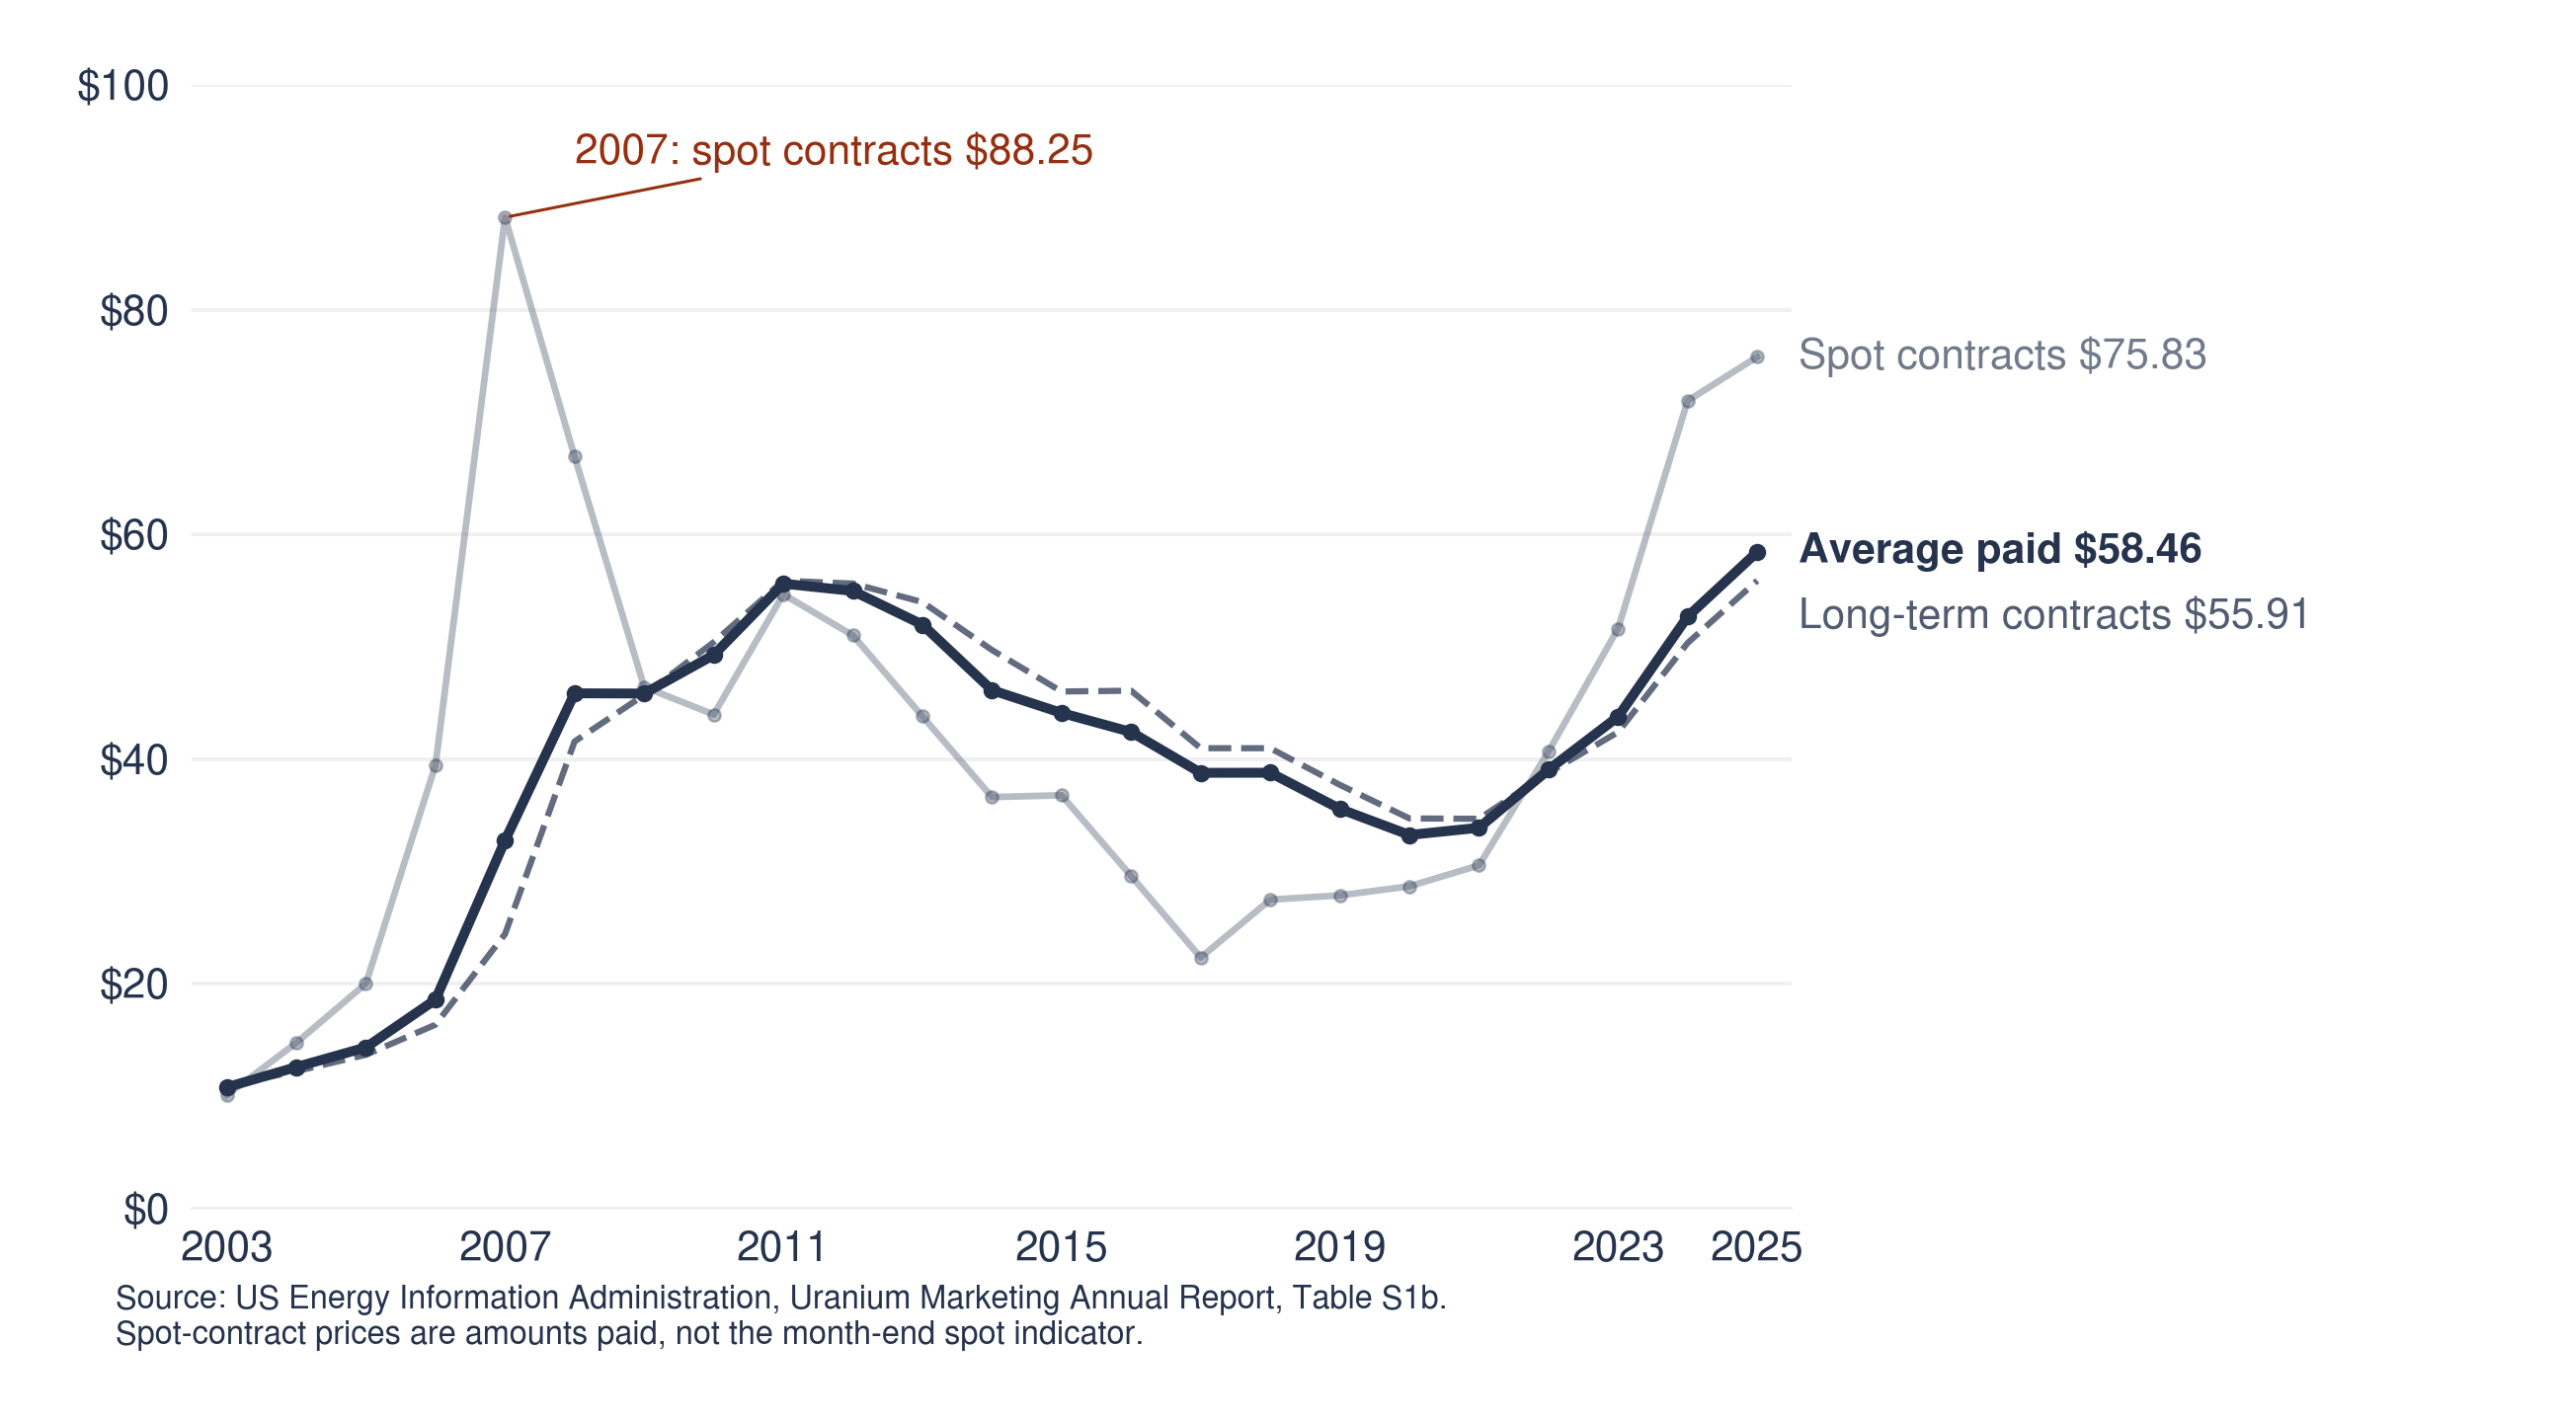
Weighted-average price paid by US reactor owners, US dollars per pound U₃O₈ equivalent, nominal, by delivery year6
Read the chart as one heavy line and one restless one. The bold line, the price actually paid, hugs the long-term line almost every year, because that's where most of the pounds come from. The spot line is the one that swings, above the others in some stretches and below them in others. Two notes: it shows what US buyers paid on spot contracts, not the month-end spot indicator, and all prices are in nominal dollars, not adjusted for inflation.
How do contracts signed years ago set what utilities pay today?
Go back to the building. Its average rent blends this year's new leases with every older lease still running. A utility's uranium bill works the same way.
Picture a fuel buyer at a US utility in 2025. Most of what arrived that year came through agreements signed earlier. Contracts signed during 2025 supplied just 4.3 million of the 46.9 million pounds US owners received, at an average of $70.46.8 Only 1.4 million of those pounds came under new long-term contracts; the other 2.9 million was spot. Less than a tenth of 2025's deliveries came from contracts signed that year.8
The rest came through older agreements, and what those cost depends on the pricing formula written into each one. EIA sorts all of 2025's deliveries, old contracts and new, into three buckets9:
| Pricing mechanism, 2025 deliveries | Pounds (millions) | Average price ($ per pound) |
|---|---|---|
| Contract-specified (fixed and base-escalated) | 29.3 | 57.19 |
| Other pricing | 14.9 | 58.03 |
| Spot-market pricing | 2.7 | 74.38 |
Pricing formulas do much of the work. Fixed pricing means an agreed price that does not automatically follow later market moves. A base-escalated contract instead starts with a base price and adjusts it over time by an agreed formula, which may use inflation indexes or a fixed rate. It is like a lease with an agreed rent-adjustment formula.4 A market-related contract refers to the spot or term price near delivery and may include a floor or a ceiling, as Cameco describes in its filings.3 One trap in the labels: EIA's 'spot-market pricing' bucket counts pounds priced off the spot market, which isn't the same as its spot-contract category.9
A utility can therefore have much of its supply contracted before the year begins while some prices remain to be determined. At the end of 2025, US owners reported just 0.95 million pounds of unfilled needs for 2026 and 2.4 million for 2027.10 Uncovered needs don't climb above 33 million pounds a year until 2033 through 2035. Existing contracts already allow up to 174 million pounds of deliveries from 2026 through 2035.2 In rent terms, most apartments are already leased, but not every lease has a fixed rent.
Contract pricing formulas shape what buyers pay at delivery
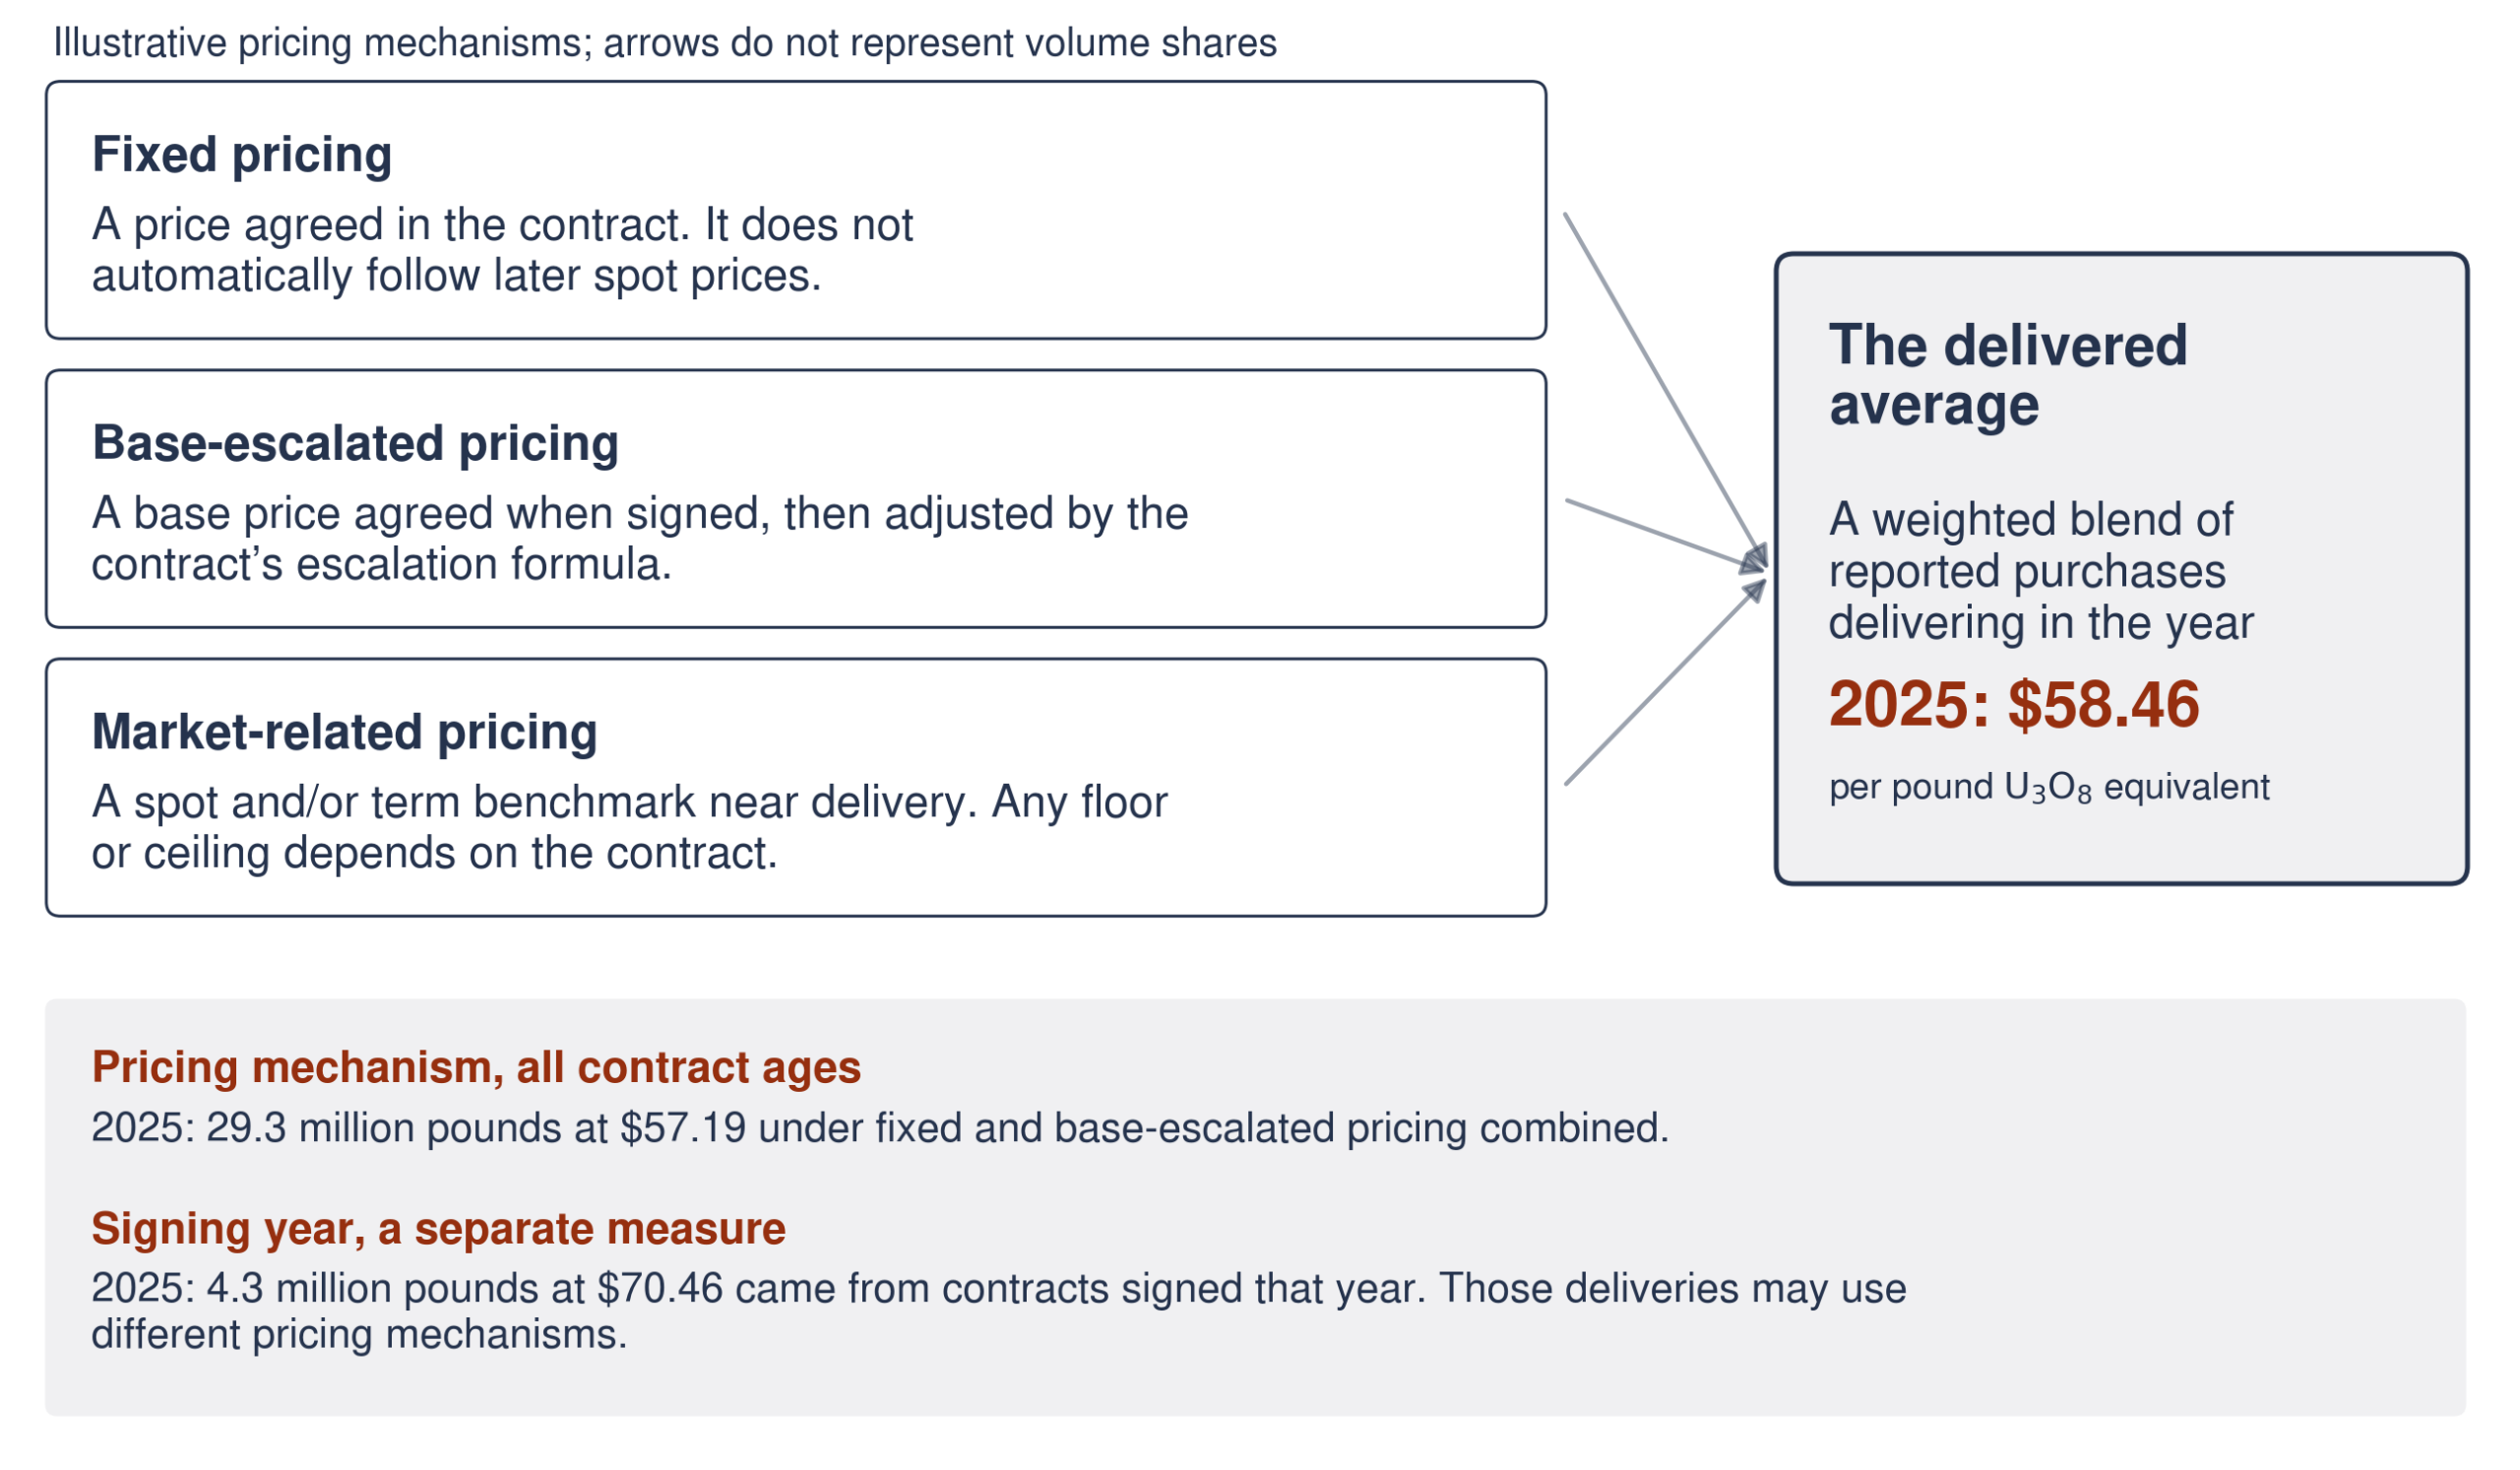
Illustrative mechanisms; signing year and pricing method are separate measures2,3,8,9,4
Each formula responds differently to new market prices. Fixed prices do not automatically reset, while base-escalated prices follow their adjustment formula. Market-related prices may reprice during an existing contract; any floor or ceiling depends on its terms. Spot purchases reflect the near-term market when agreed, which can precede actual delivery.3,6,5,4
Why can the spot and term markets move in different directions?
Different delivery needs can pull spot and term indicators in different directions.5,4
They serve different needs. A spot buyer wants pounds soon, often to cover a delivery or fill a gap. A term buyer, usually a utility, is securing fuel for reactors years ahead. The term indicator estimates a base price for new supply agreements with later deliveries.4
The spot market can also be thin. Kazatomprom, Kazakhstan's national uranium company, cited third-party analysis describing September 2026 activity as among the lowest in many years, even as the spot price touched a quarterly high of $90.10 in mid-September.11 The reported monthly term indicator can remain unchanged while spot moves. It sat at $80.00 at every month-end from February to June 2025.1
This year shows how far apart the two can travel. At the end of January 2026, spot was $94.28 and term $89.00.1 By the end of May they had crossed: spot had fallen to $84.18 while term had risen to $94.00. Term hadn't fallen at a single month-end through October 2026, when it reached $98.00. Sometimes the two come close, as they did at the end of September 2025, at $82.63 for spot and $83.00 for term.1
Higher term prices had not brought a rise in reported contracting volume in the first nine months of 2026. Industry long-term contracting came to about 42 million pounds, against about 45 million a year earlier, according to UxC data cited by Cameco.3 And history shows how far apart delivered prices can drift: in 2007, US spot-contract buyers paid an average of $88.25 a pound while long-term deliveries averaged $24.45.6
What does the gap mean for uranium producers' revenue?
Contracts shape both sides of a trade. The price a utility pays under a particular agreement is the seller's revenue per pound on that sale. Producers' own disclosures show how their contract portfolios can differ from headline quotes.
Take Cameco. Its average realized uranium price, what it actually received per pound, was $65.78 in the third quarter of 2026, up 6% from $62.12 a year earlier. Spot ended that quarter at $89.63, nearly $24 higher. The average month-end spot price over the same quarter was $88.56. Using that quarterly benchmark in place of Cameco's realized selling price would have overstated revenue per pound by more than a third.3
Cameco explains the gap itself. Changes in its realized price generally lag changes in market prices, it says, whether prices are rising or falling, and many of its market-related contracts delivering in 2026 are subject to ceiling prices.3 It also has contracts in place for average annual deliveries of over 28 million pounds from 2026 through 2030.12 These agreements commit delivery volumes; the revenue received still depends on their pricing terms.
Kazatomprom gets to a similar place by a different route. Its preliminary group average realized price was $73.51 for the first nine months of 2026, against an average month-end spot price of $87.41.11 Its long-term contracts are linked to spot, the company says, but some include fixed components, including ceilings, negotiated in a different price environment.
Cameco's figure covers one quarter and Kazatomprom's nine months, so the two can't be lined up exactly. The lesson is the same, though. A producer's revenue per pound depends on its contract mix and delivery timing. Floors can cushion a price fall where they apply, ceilings can cap gains, and base-escalated prices follow their formula. Depending on those terms, a producer's realized price can rise less than spot in a rally and fall less in a slump. The response varies across contract portfolios and reporting periods.3,11
How do higher spot prices reach existing contracts?
They can feed through at different speeds, depending on repricing clauses and when agreements are renewed.
That change can show up gradually in delivered averages. The average price paid by US owners rose every year from $33.27 in 2020 to $58.46 in 2025.6 Pounds from contracts signed in 2025 cost $70.46, about $12 above the overall average.8 As market-related contracts reprice and older agreements are replaced, newer market conditions can make up a bigger share of the blend. Back in the building, some leases adjust while others reset only when renewed.
Pass-through depends on repricing terms as well as contract renewal, with ceilings, floors and escalation formulas shaping the result. It also works in reverse. From 2010 to 2021, long-term deliveries cost US owners more than spot purchases every year.6 Older, higher-priced agreements can keep delivered costs above current spot purchases. Back then, the old leases could be the expensive ones.
That's why one popular shortcut can mislead. Substituting spot for the actual selling price can overstate revenue per pound, as the Cameco and Kazatomprom figures show for the periods cited. In a falling market, floors and older contracts can produce the opposite result. Revenue from uranium sales also depends on the volume sold, which can differ from the company's current mine output. Production and sales are separate measures.3,11
The three numbers answer different questions. Spot and term indicators assess market conditions for new near-term and long-term supply. The delivered average records what US reactor owners paid under agreements with different ages and pricing terms. A producer's realized price reflects its own contract mix and delivery timing. For the 2026 periods cited, Cameco and Kazatomprom both reported realized prices below their spot benchmarks; the extent and speed of pass-through depend on the contracts.3,11
Frequently asked questions
What is the uranium spot price? An assessed price for near-term uranium supply. UxC's current indicator considers delivery within three months; EIA's separate spot-contract category usually covers delivery within a year of signing.5,6 Cameco's average of the UxC and TradeTech month-end indicators was $91.55 a pound on October 30, 2026.1
Why does EIA's spot figure differ from the published spot price? EIA reports the weighted average US reactor owners actually paid under spot contracts delivered during a year6. Published indicators are point-in-time assessments, so the two rarely match.
What does 'base-escalated' mean? A base price is agreed when the contract is signed, then adjusted by an agreed escalation formula. This differs from a market-related price determined near delivery.3,4
How far ahead are US utilities covered? Reported coverage was strongest in the near term. At the end of 2025, unfilled needs were 0.95 million pounds for 2026 and 2.4 million for 2027. Across 2026 through 2035, unfilled needs totaled 186 million pounds, most of it after 2030.10 This measures uncontracted volume, not future price certainty.
Sources & Disclosure
1 Uranium Price. Cameco, monthly indicators through October 30, 2026; month-end spot and long-term indicators (average of UxC and TradeTech), 2025 to 2026, and note that uranium is negotiated privately. 2 Uranium Marketing Annual Report. US Energy Information Administration, released July 29, 2026 (re-released August 13, 2026); 2025 purchases and weighted-average prices, uranium-concentrate-equivalent units, Table 7 material forms, spot and long-term shares, and maximum contracted deliveries for 2026 to 2035. 3 Management's discussion and analysis for the quarter ended September 30, 2026. Cameco, October 30, 2026; contract pricing mechanisms, ceilings and floors, realized prices, price sensitivity table, long-term price comment, industry term contracting. 4 Uranium Price Definitions; Long-Term Price Indicators; Uranium Contract Pricing. TradeTech, accessed November 7, 2026; daily, weekly and monthly reporting, base-price and escalation definitions, and fixed, base-escalated and market-related pricing mechanisms. 5 Nuclear Fuel Price Indicators; About Uranium Prices. UxC, accessed November 7, 2026; assessed indicators, spot delivery specifications, daily and weekly reporting, and market-related contract pricing. 6 Table S1b. Weighted-average price of uranium purchased by owners and operators of U.S. civilian nuclear power reactors, 2003-2025. US Energy Information Administration, 2026; total, spot-contract and long-term-contract prices by year, contract definitions. 7 Table S1a. Uranium purchased by owners and operators of U.S. civilian nuclear power reactors, 2003-2025. US Energy Information Administration, 2026; spot and long-term quantities by year. 8 Table 8. Contracts signed in 2025 by owners and operators of U.S. civilian nuclear power reactors by contract type. US Energy Information Administration, 2026; 2025 deliveries and prices under contracts signed in 2025. 9 Table 5. Average price and quantity for uranium purchased by owners and operators of U.S. civilian nuclear power reactors by pricing mechanisms and delivery year, 2024-2025. US Energy Information Administration, 2026; 2025 deliveries by pricing mechanism. 10 Table 11. Unfilled uranium market requirements of owners and operators of U.S. civilian nuclear power reactors, 2025-2035. US Energy Information Administration, 2026; unfilled needs as of December 31, 2025. 11 Kazatomprom 3Q26 Operations and Trading Update. Kazatomprom, November 3, 2026; September spot activity, long-term price comment, realized versus spot prices for the first nine months of 2026. Figures are preliminary. 12 Cameco Reports Third Quarter Results: Year-to-Date Performance as Expected; Nuclear Industry Fundamentals Continue to Strengthen; Disciplined Strategy and Integrated Nuclear Exposure Support Long-term Value Creation; Annual Dividend Declared. Cameco, October 30, 2026; average annual contracted deliveries over the next five years.
Wealthion is a dba of Greylock Peak Investments, a registered investment adviser. This article is general information only. It is not investment advice or an offer or solicitation, and it is not tailored to your circumstances. Guests’ views are their own and may not reflect those of Wealthion. Wealthion has not verified guest statements, including any performance figures. Investing involves risk, including loss of principal, and past performance does not guarantee future results. Wealthion refers readers to other registered investment advisers and shares in the fees they receive from referred clients, which creates a conflict of interest. Please see our Form ADV Part 2A and consult your own financial advisor before investing.
What Serious Investors Are Watching
Dive into expert interviews, market analysis, and long-form content built to help serious investors think long-term.

Gold IRAs Explained: What the Rules Allow and What They Cost
An annual account fee is easy to spot. The extra amount built into a gold...
Uranium Spot vs Term Prices: Why the Headline Price Isn’t What Most Utilities Pay
Uranium headlines quoted $91.55 a pound at the end of October 2026. Reactor owners in...

REITs Explained: How Real Estate Investment Trusts Work
A REIT lets you own a share of real estate income without owning a building....
Enjoyed This? Get More Insights
Expert insights and curated opportunities, delivered to your inbox.
Ready to Position for What's Coming?
Whether you're still learning or ready to act, your next step starts here.
- Independent
- Macro-Informed
- Real Asset Focused


The Wealthion Network
By subscribing, you agree to receive Wealthion emails. Unsubscribe anytime.
The Wealthion Network
By subscribing, you agree to receive Wealthion emails. Unsubscribe anytime.
Network Discussion
Join the Wealthion Network to Comment